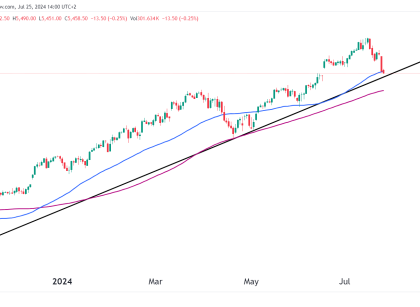
Introduction YM is flat year-to-date but is only 10% away from all-time highs. With most equity indices, YM’s low was back in October of 2022, which is exactly one year ago. The price rallied 25% from there before retracing 7% to current price levels. Weekly Chart YM has been between $28,679 and $36844 since the Read More…
Tag: E-mini S&P 500 (ES)
S&P 500 Futures (ES) Technical Outlook
Technical Analysis If we zoom out on the daily chart, there is a clear break of trend that has occurred after the high was put in at $4600. Since then there were two new lower lows formed on the daily chart, which I circled on the chart below, and the RSI confirmed both of them Read More…
Euro Futures (6E) Reverses, Bulls Await To Pounce
Introduction Last Week, 6E closed with a green bullish hammer on the weekly chart after 10 out of 11 red weeks. A huge decline in value for the Euro. The selling in the Euro has been volatile, with every buy getting sold heavily into. The bears have been in control primarily because the Dollar has Read More…
A Fresh Look At The S&P 500 Futures After Bullish Candle Reversal
Technical Analysis ES has been in an uptrend this year, and after a sizeable pullback of 8.8% from the recent local top, it appears that the low might be in and could be the opportunity that bulls have been waiting for. Yesterday (Monday, October 10) price action formed a morning star candlestick pattern, and if Read More…
The Beginner’s Guide to Trading Price Action
Price action trading is one of retail trader’s and investors’ most popular trading techniques. It involves analyzing an asset’s price movements on a chart to identify trade opportunities, without relying on technical indicators. Mastering price action can take time, but the basic principles are straightforward enough for beginners to understand. This guide will cover the Read More…
NASDAQ Futures (NQ) Buying Opportunity Awaits
Bulls Are Ready The bulls are ready to pounce as NQ trades within the support zone at $14,800. This is the most significant zone on the chart at the moment, and a bounce from here could mark the opportunity to go long. In this week’s analysis of NQ, we are going to keep it short Read More…