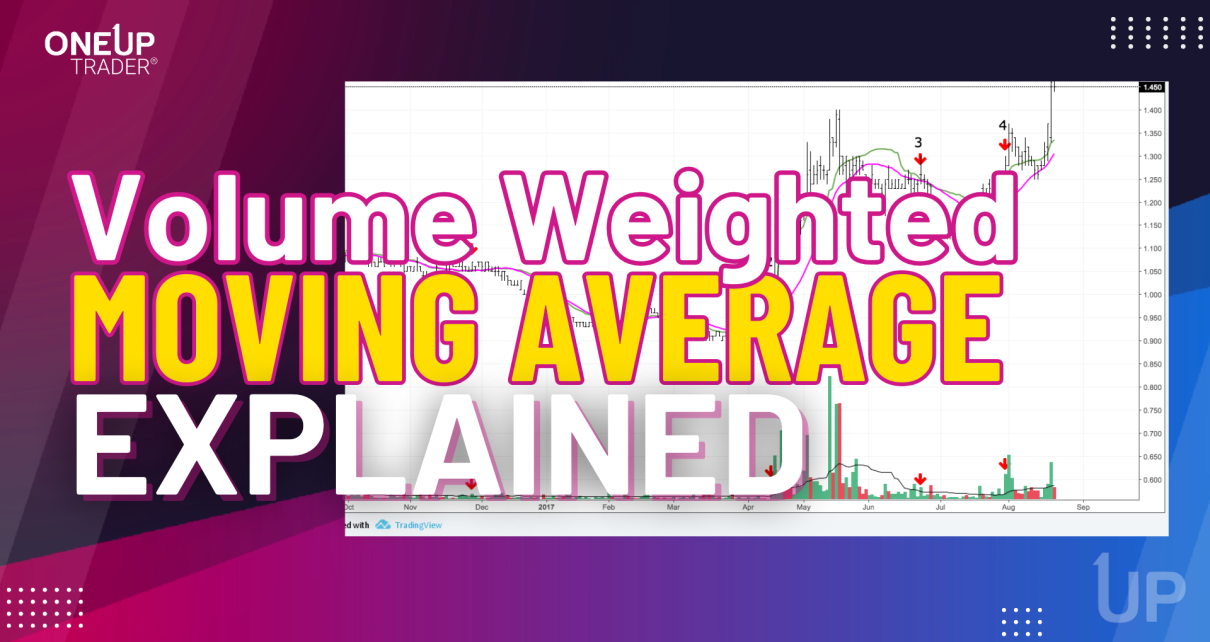
rty daily chart technical analysis
Technical Analysis

E-mini Russell 2000 Futures Daily Technical Analysis – January 8, 2025

Introduction The E-mini Russell 2000 Futures (RTY) continues to trade within a well-established bullish channel. The channel is not very strong, but nevertheless, the price is rallying over the long term. Lets take a closer look at the technicals. Technical Analysis Bullish Channel Formation Support and Resistance Levels Indicators Analysis Relative Strength Index (RSI) Bullish Read More…

Fundamental Analysis

Equities Gain Ground as Tech Outperforms Despite Elevated Yields

Equities climbed to a one-week high on Monday as technology stocks rose despite high Treasury yields. However, market participants remained cautious ahead of key US economic data this week that will shape the outlook for Fed rate cuts.  Like many times in the past, tech stocks defied the general trend and rose on Monda. Microsoft Read More…

Technical Analysis

S&P 500 E-mini Futures Daily Technical Analysis – January 6, 2025

The S&P 500 E-mini Futures (ES) continues to trend upwards within a well-defined ascending channel. The bullish trend remains intact due to a combination of technical and positive market sentiment across equity markets globally. As equities continue their rally, dips are presenting high-probability buying opportunities for traders looking to ride the trend higher. Let’s take Read More…

cesar funded trader withdrawal at OneUp Trader funded trader program
Funded Traders Funded Trading Withdrawals

Cesar returns with another 25K withdrawal: A dive into the mind of a master trader

Introduction After sharing Cesar V.’s remarkable achievement of withdrawing $76,500 in 40 days, we had the opportunity to sit down with him again to understand how his trading has evolved. What we discovered was not just a story of successful trading but a profound insight into how he understands and approaches the markets through the Read More…

Fundamental Analysis

Equities Climb as Markets Eye Upcoming FOMC Meeting

Equities rose on Monday, with the Nasdaq hitting record highs as market participants looked forward to the upcoming FOMC policy meeting. At the same time, investors absorbed mixed PMI data from the US that showed pockets of weakness and strength in the economy.  The Federal Reserve will hold its policy meeting on Wednesday, and markets Read More…

Technical Analysis

NASDAQ 100 E-mini Futures Daily Technical Analysis

Chart OverviewThe Nasdaq 100 E-mini Futures are showing signs of exhaustion at current levels, as the price action is forming a rising wedge pattern—a bearish signal when it appears at the top of a rally. With the price sitting near 21,800, the market appears stretched. Let’s break down what this could mean for traders and Read More…