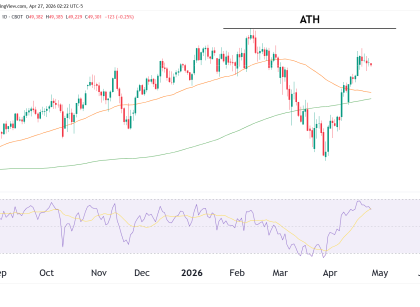
YM dow jones technical analysis
Technical Analysis

E-Mini Dow Jones Futures (YM) Technical Analysis November 4, 2024

📈 Current Market Structure and Key Levels The E-mini Dow Jones (YM) futures recently reached an All-Time High near the 44,000 mark before facing a mild correction of 4%. This pullback phase has brought prices back toward some key zones that might offer high-probability entry points for bullish trades. Let’s break down these zones and Read More…

dow jones technical analysis
Technical Analysis

Dow Jones Futures (YM) Spinning Top Candlesticks

Weekly Chart The weekly chart has formed spinning tops near the recent all-time high. This tells us that there is indecision in the market. The RSI is currently overbought at 71.31. before the formation of the spinning tops there was only 1 red week out of 14. This amount of bullish price action cannot last Read More…