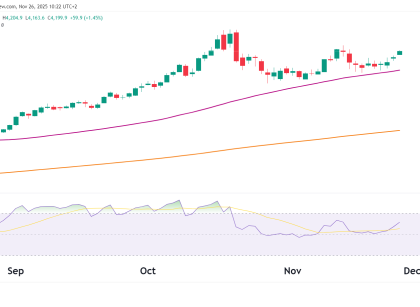
Technical Analysis

NQ Daily Chart Technical Analysis – July 25, 2025

Technical Analysis After a persistent multi-week rally, the NASDAQ 100 has continued its rally up 42% since the lows in April. The index recently broke above its previous all-time high (ATH), but the current candles show narrow bodies near the upper Bollinger Band, accompanied by a flattening RSI near overbought. Chart Highlights: Macro & Global Read More…

Technical Analysis

S&P 500 Futures (ES) – Technical Analysis July 24, 2025

Introduction Previous analysis: ES Futures Analysis – July 14, 2025 The S&P 500 futures continue with the strong uptrend, now reaching new all-time highs with barely any pullback since the mid-June breakout. The weakening US Dollar undoubtedly is impacting this. The daily RSI has just breached 72.91, entering overbought territory. When the RSI is at Read More…

gold technical analysis
Technical Analysis

Gold Futures (GC) Technical Analysis – July 23, 2025

Previous update: Gold Technical Analysis – July 15, 2025 Recap & Context In the last update, we noted that Gold was compressing along trendline support and the 50-day moving average, forming a higher low setup just under the ATH zone. Today, we are seeing confirmation: GC has surged above the pivot level of $3,345.6, tagging Read More…

crude oil technical analysis
Technical Analysis

Crude Oil Futures (CL) Technical Update – July 22, 2025

Recap from Last Update In our July 10th article, we highlighted the $67–$69 resistance-turned-support zone as the key zone to be focused on. We also noted the looming Iran-Israel geopolitical risks, which created temporary volatility but failed to produce a lasting trend shift. Since then, CL has remained range-bound, and as of today, it’s pressing Read More…

Technical Analysis

Nasdaq 100 Futures (NQ) – Technical Analysis 18/07/2025

Introduction The Nasdaq 100 continues to grind higher, notching fresh all-time highs above the previous ATH at 22,425, confirming the bullish breakout structure discussed in our previous analyses. While price action remains strong, momentum indicators are showing signs of fatigue, which could hint at a short-term breather. Key Technicals Probability Table Scenario Estimated Probability Key Read More…

Technical Analysis

Russell 2000 Futures (RTY) Technical Analysis – July 16 2025

Introduction Russell 2000 E-Mini Futures (RTY) are trading at 2,213.3, down slightly by -0.23% on the day. After a strong multi-week rally off the April lows, price has paused and is now pulling back from the 2,230s, testing the 200-day MA and previous minor resistance-turned-support near 2,212.7. Its a important level to watch to see Read More…