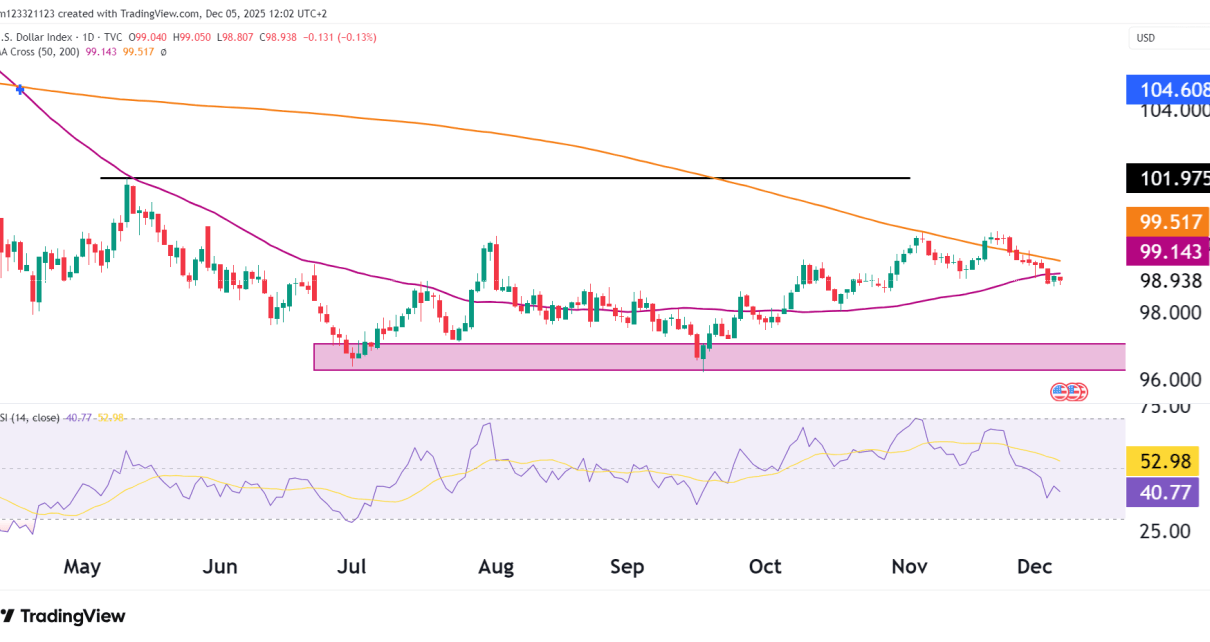
Market Snapshot Metric Value Current Price at time of writing 1.16395 50-Day MA 1.16444 200-Day MA 1.09894 Key Resistance 1.1700 – 1.1800 Key Support 1.15625 (range floor), 1.14250 (major swing low) Technical Overview Weekly Chart The weekly chart is a good way to show the strength of the long-term trend of any asset. The Dollar Read More…
Technical Analysis
Nasdaq Futures (NQ) Rally Continues, 11 August 2025
Introduction Nasdaq (NQ) futures are close to making new highs again after a short but sharp 4.4% pullback. Market Snapshot Metric Value Current Price As Of Article 23,738.50 Day’s Change +24.75 (+0.10%) 50-Day MA 22,707.56 200-Day MA 21,208.43 Pivot Point (P) 23,264.00 Key Resistance Levels 23,946 (R1), 24,527 (R2), 25,209 (R3) Key Support Levels 23,264 Read More…
Crude Oil Futures (CL) Technical Analysis, 8 August
Technical Overview Trend and Structure Momentum & Volatility Key Technical Levels Level Type Description 68.50 Pivot (P) Prior rejection level, key resistance 66.61 50DMA Broken support turned resistance 62.31 S2 First strong support test 59.94 S3 Critical downside level 71.62 R1 Bullish breakout reclaim level Probability Table Scenario Estimated Probability Commentary Continuation lower to test Read More…
S&P 500 (ES) Technical Analysis, 7 August 2025
Market Snapshot Metric Value Price as of 7 August 6,385.25 Day’s Change +14.25 (+0.22%) 50-Day MA 6,201.13 200-Day MA 5,940.58 14-Day RSI 59.02 Technical Overview Price Structure & Trend Momentum & RSI Key Technical Levels Level Type Significance 6,450–6,460 Resistance All-time highs zone 6,290–6,300 Support Recent low and short-term demand zone 6,201 50MA Strong trend Read More…
Nasdaq Futures (NQ) Technical Analysis, 5 August 2025
NQ Daily Chart Price as of 5 August 2025: 23,366.7550-day MA: 22,529.31200-day MA: 21,147.31Pivot (P): 23,264.00Recent Lows: 22,820–22,850 (just above S1)Resistance Zones: Technical Breakdown Short-term Rebound Attempt Structure & Caution Flags Probabilities Table Scenario Estimated Probability Commentary Reclaim R1 (~23,946) and trend resumes 35% Needs strong follow-through and breadth Chop in 22,700–23,700 range 45% Most Read More…
Gold (GC) Technical Analysis, 1 August 2025
Current Price: 3,342.30Change: -6.30 (-0.19%)ATH: ~3,51050-day MA: 3,355.4200-day MA: 3,008.8RSI (14): 48.45 (Neutral to Weakening) Gold Trend This Year Technical Analysis Technical Context Indicator / Feature Current Reading Implication Price vs ATH ~170 pts below ATH Consolidation under key resistance 50-day MA Price sitting on it Neutral support test Trendline (YTD) Still holding Break would Read More…


