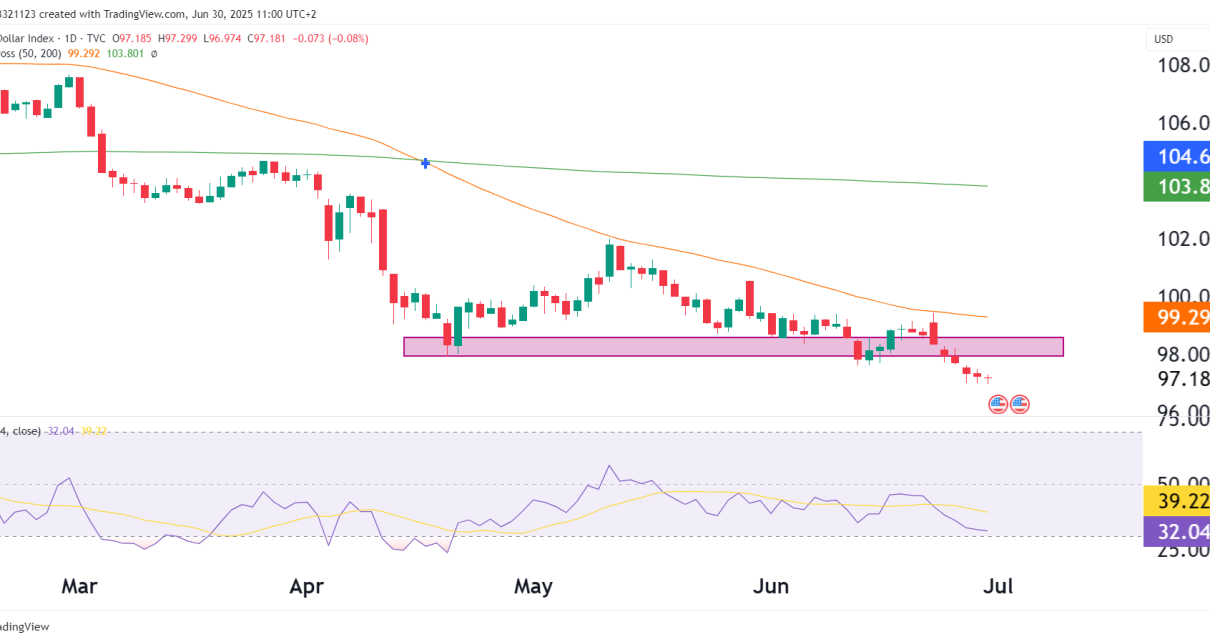
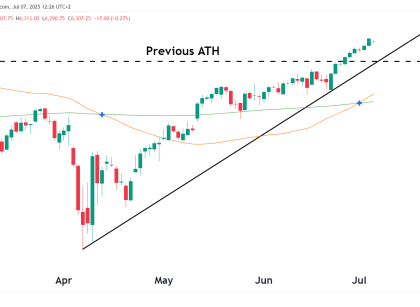
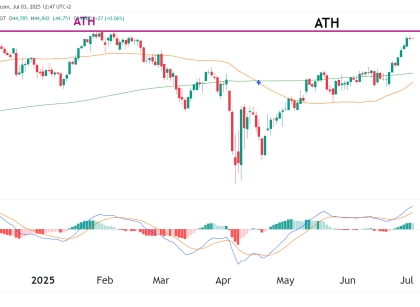
Technical Analysis

Bull Target Hit On Crude Oil Futures!

Introduction In our earlier analysis, I mentioned key levels in CL crude futures, focusing on a support zone between $66-$71 and a potential breakout above $78.04. There was an expectation of a rally towards higher targets if the price successfully broke above the descending trendline and the 100-week EMA. With escalating geopolitical tensions involving Iran Read More…

Technical Analysis

U.S. Dollar Surges on Fed Policy, Technical Outlook

Introduction The Dollar has been surging for the past few sessions, posting five straight green candles. Without looking at any fundamentals in today’s overview, lets dive straight into the technicals and see what we can find. Technical Analysis The Dollar is overextended in the short term with the RSI in overbought territory. Price has also Read More…

6C daily chart on OneUp Trader funded trader program
Technical Analysis

Bearish Divergence on Canadian Dollar (6C)

Introduction We haven’t looked at 6C for a while, but there is an interesting pattern we can look at and learn from. Let’s break down the analysis and find high-probability trade setups while explaining the bearish divergence pattern highlighted in the image. Before we go further, you can learn all about bearish divergence in the Read More…

Technical Analysis

Crude Oil prices up 6% on Middle East tensions, technicals point to $78 target

Fundamentals WTI crude futures rose 1.56% to $70.92 per barrel late Tuesday as fears of oil supply disruptions grew after Iran launched ballistic missiles at Israel. Iran fired over 180 missiles in retaliation for Israel’s campaign against Hezbollah in Lebanon, escalating tensions in the oil-rich region. ANZ Research noted Iran’s involvement raises concerns about potential Read More…

Technical Analysis

Short Trade on Russell 2000 (RTY) Futures, $2,135 in sight

Introduction As we approach the final quarter of 2024, the E-mini Russell 2000 Index Futures presents a short trade opportunity that has caught our attention. After a 23% rally for the past year and multiple tests of the resistance level shown on the chart below, it could be time for a pullback. Let’s see what Read More…