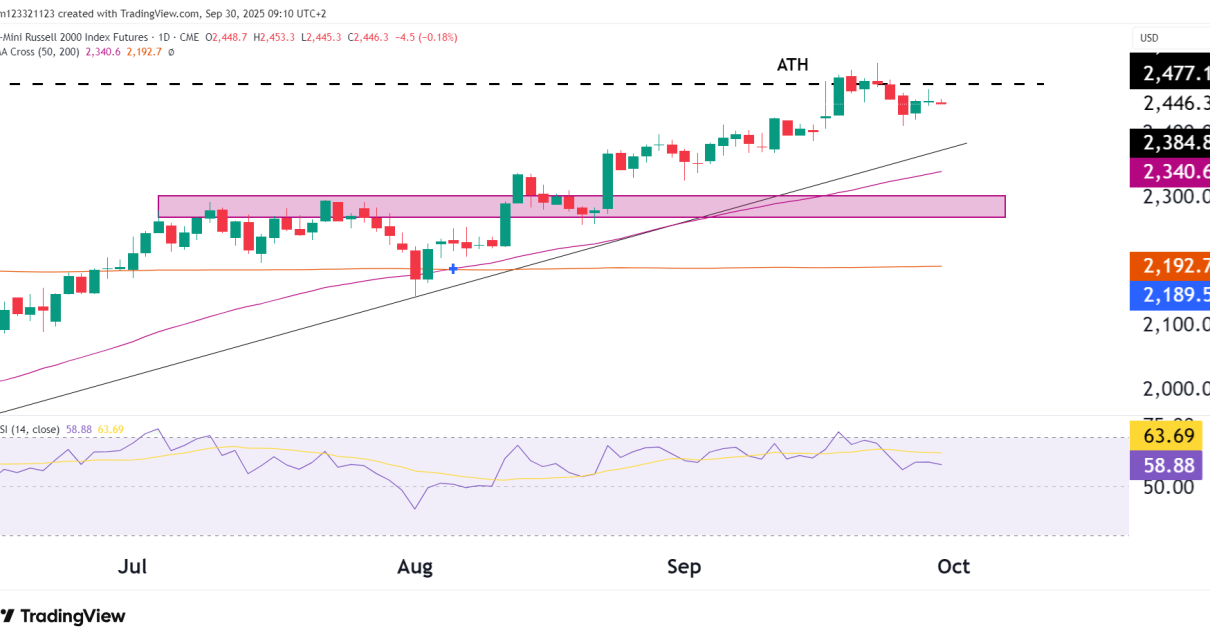
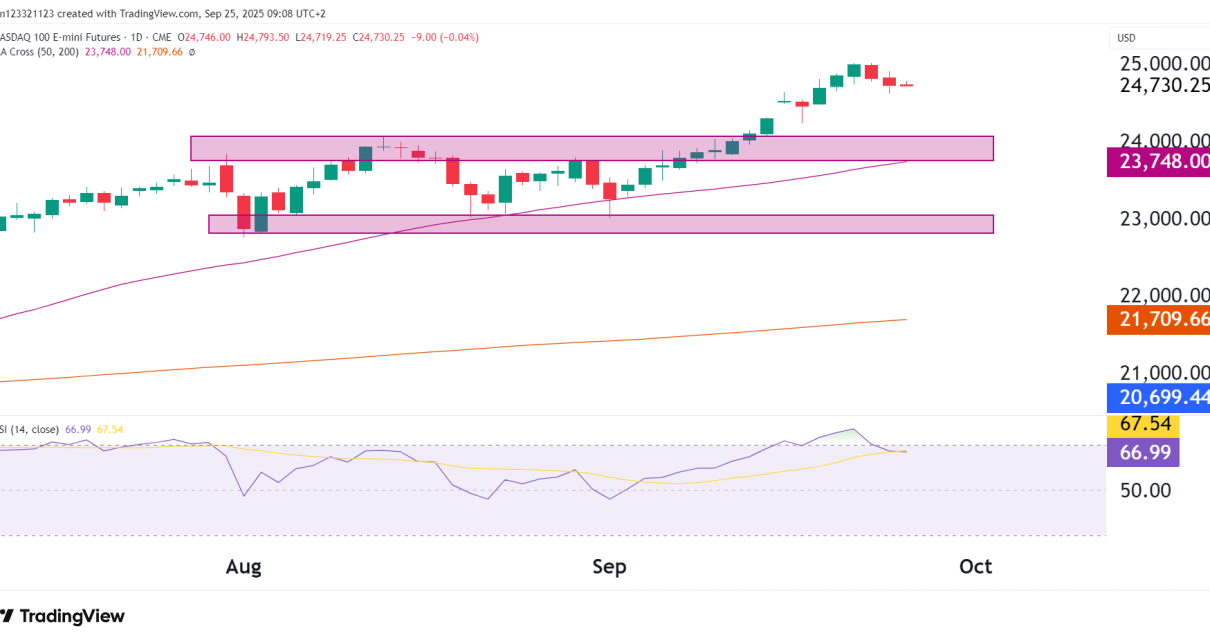
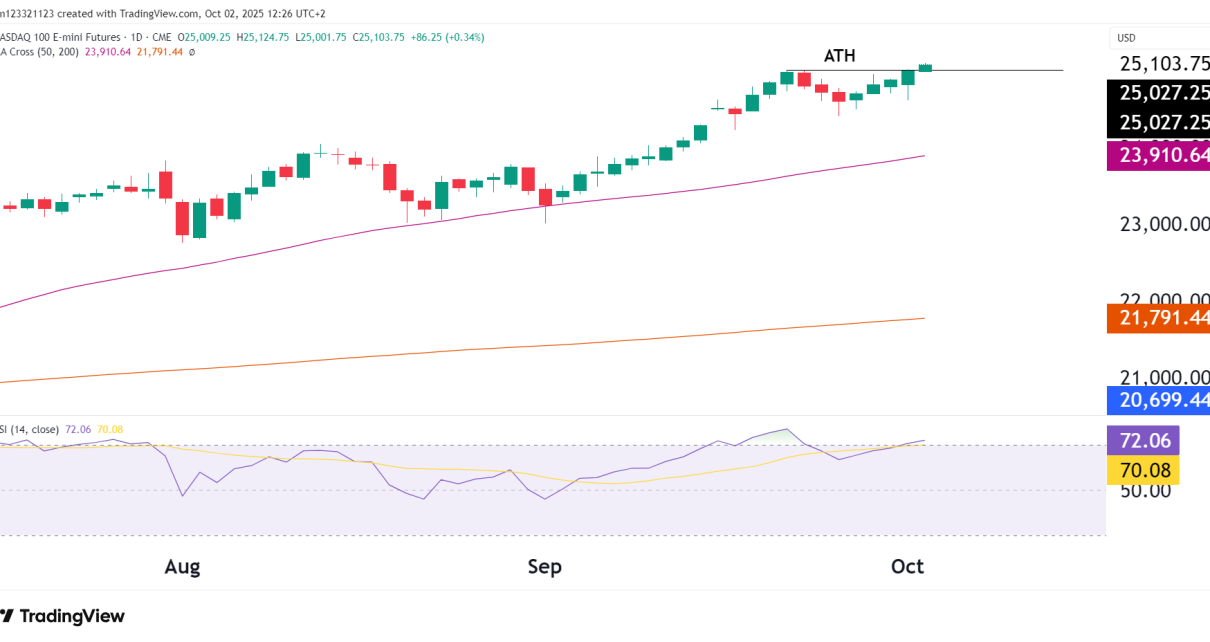
Introduction The NASDAQ 100 (NQ) futures have fallen sharply since the middle of February. The recent sell-off was triggered by a double top pattern near 22,367.00, pushing the index to test the lower boundary of its long-term ascending channel. With the market now sitting at a key support level, the next move will likely set Read More…
Technical Analysis
U.S. Dollar Index (DXY) Plummets—Market Reacts to Trump-Zelensky Interview and Broader Fundamentals
Introduction The U.S. Dollar Index (DXY) experienced a sharp decline, dropping 3.54% to 103.76, breaking below a support zone held since November 2024. The sell-off was triggered by a combination of fundamental factors, including recent macroeconomic data, shifting Federal Reserve expectations, and a controversial interview with former President Donald Trump that may have influenced market Read More…
Gold Futures (GC) Bulls Still in Control
Introduction Gold futures (GC) continue its bullish trend in an ascending channel on the weekly chart. However, on the daily timeframe, price action is consolidating, with mixed signals on whether a breakout or pullback is more likely in the short term. Gold Fundamentals Central Bank Policies & Interest Rates Inflation & Safe-Haven Demand Weekly Chart Read More…
Euro Futures (6E) Surges as ECB Hawkish
introduction Euro FX Futures (6E) have surged lately as the Dollar strength diminishes. The recent move is supported by both technical strength and fundamental catalysts, with the euro gaining momentum against the dollar. As of today, Euro futures are trading at 1.07090, up +0.95%, showing a strong bullish breakout above the 1.06305 resistance level. The Read More…
Crude Oil Futures (CL) Test Yearly Support—Breakdown or Bounce?
Introduction Crude Oil Futures (CL) are approaching a major support zone after a failed breakout attempt at the downward trendline and 100-week SMA in the previous analysis. The market remains under selling pressure. As of today, CL is trading at 67.67, down -3.00%, and nearing the key support zone between 66.00 and 68.00. A break Read More…
S&P 500 futures (ES) Bullish Reversal Candle
Introduction S&P 500 E-mini futures (ES) have shown signs of stabilization following a sharp break below the long-term trendline. The latest price action has formed a bullish inside day, so there is potential exhaustion of the recent sell-off and the start of a short-term rebound. As of today, ES is trading at 5,977.25, up +0.23%, Read More…