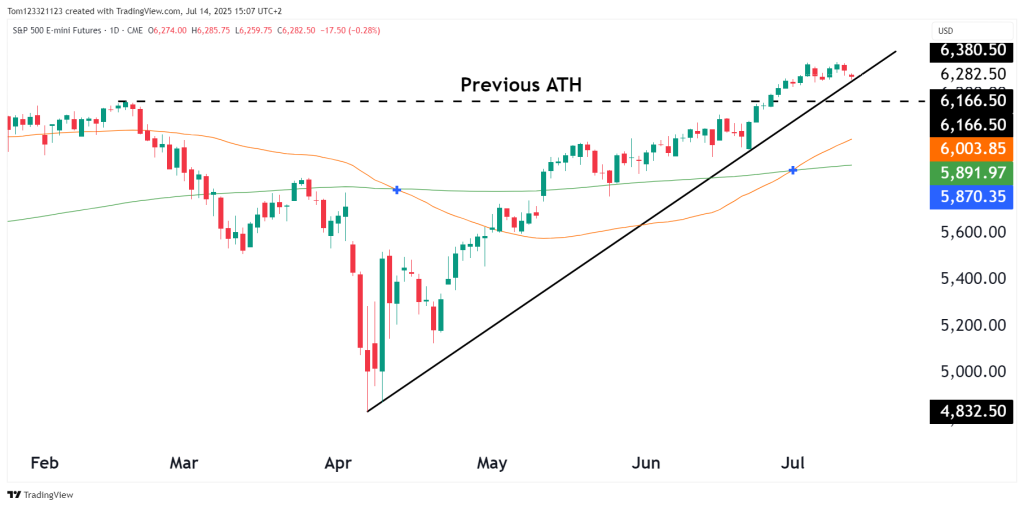
The S&P 500 E-mini futures (ES) remain in a strong uptrend, currently trading at 6,282.50, just shy of the recent all-time high breakout level of 6,380.50. While bulls maintain control, today’s chart shows the index pulling back modestly, hinting at some momentum exhaustion near the highs.
Despite the softness, the price remains well above key support levels and the ascending trendline from April remains intact.
Technical Breakdown
Indicator
Reading
Comment
Price
6,282.50
Slight fade from new highs
Previous ATH
6,166.50
Now acting as new support
200-day MA
5,891.97
Slope turning upward
50-day MA
6,003.85
Tracking trendline support
Trendline Support
~6,220
Dynamic uptrend guide
Support & Resistance Levels
Level Type
Zone / Price Range
Immediate Resistance
6,380–6,400 (recent highs)
Short-Term Support
6,220–6,250 (trendline + minor structure)
Major Support
6,166.50 (previous ATH breakout)
Key Moving Average
6,003–6,005 (50-day MA)
Probabilities Table
Scenario
Probability
Implication
Continued grind higher to 6,400–6,500
55%
Momentum continuation
Retest of 6,220–6,250 (trendline)
30%
Normal pullback in uptrend
Break below 6,166 = failed breakout
15%
Short-term top may be in place
Key Takeaways
Trend remains bullish, but short-term RSI divergence and today’s red candle signal possible slowing.
The 6,166.50 ATH breakout level is now a critical bull-bear line—as long as price holds above it, the bias remains to the upside.
Trade Opportunities
Strategy Type
Description
Trend Buy on Pullback
Entry near 6,220–6,250, stop under 6,166
Breakout Scalping
Buy on clean break above 6,380, target 6,440+
Options Play
Aug 6,200–6,400 call spread for continuation
Timeframe Outlook
Timeframe
Bias
Comment
Short-Term
Cautiously Bullish
Minor cooling, but structure intact
Medium-Term
Bullish
Higher highs and higher lows
Long-Term
Bullish
Above key MAs with macro tailwinds (e.g. dollar weakness)
Ending Off
The S&P 500 futures remain in breakout territory, but with early signs of fatigue. Bulls want to see continued strength above 6,250 and a reclaim of momentum toward 6,400+ for confirmation. Watch the 6,166–6,220 zone closely for clues—this is where short-term control will be decided.
Overview of the U.S. Dollar Index (DXY):The U.S. Dollar Index (DXY) is currently trading around 101.724, showing a recent bounce from a key support level. The DXY has been in a broad descending wedge pattern, which is generally considered a bullish continuation pattern. The bounce from 100.8 to 101.724 is significant, as it coincides with Read More…
Introduction Crude oil futures have jumped 3.35% to $60.46 on Wednesday at the open, posting their biggest daily gain in over two weeks. CL is also up 8.8% since the low on the 20th of October, where the buyers stepped back in after a sharp selloff, and the price bounced from the $56–$57 support zone. Read More…
U.S. stock index futures fell on Friday morning amid heightened tensions in the Middle East and a disappointing revenue forecast from Netflix. An Israeli attack on Iranian soil escalated concerns over regional stability. The CBOE Volatility Index climbed to its highest level in over five months as well as markets digested the news. Dow e-minis, Read More…