

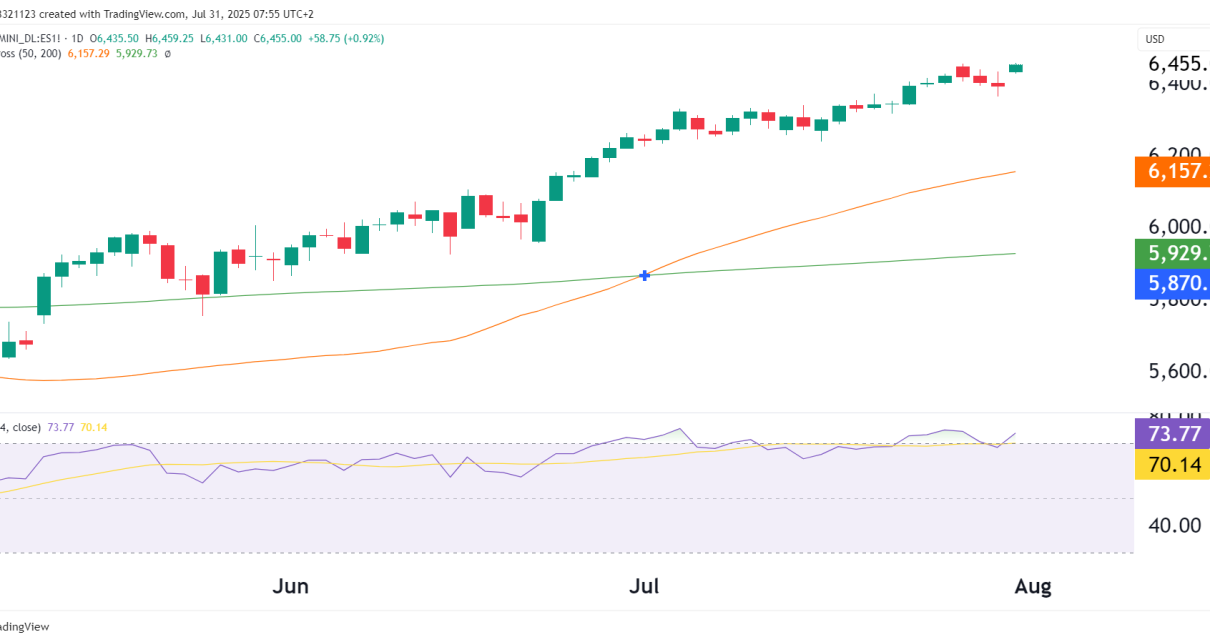
Price: 6,455.00
Day Change: +0.92%
RSI (14): 73.77 (Overbought)
50-day MA: 6,157.29
200-day MA: 5,929.73
Price Structure Update
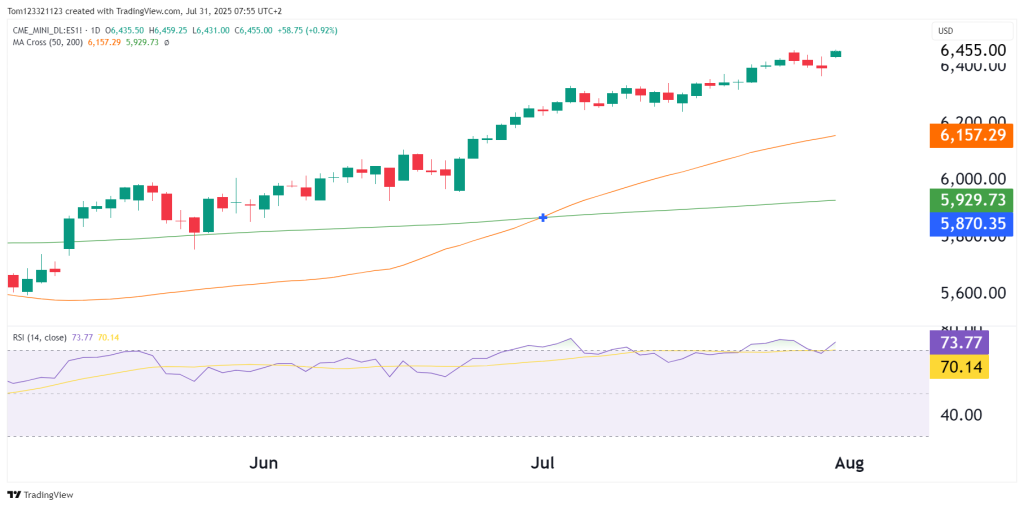
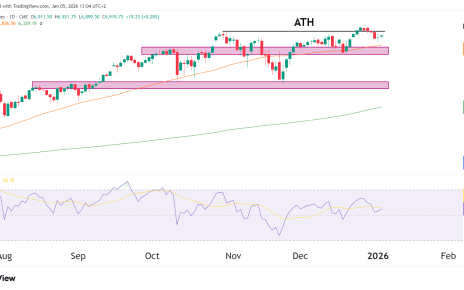
Since the previous analysis, the S&P 500 futures have continued with the grinding uptrend since breaking the previous ATH back in June.
- Bullish structure remains intact, consistent, and natural.
- RSI is now at 73.77, deep in overbought territory, but not showing divergence yet—suggesting momentum remains intact for now.
- No major rejection candles or topping formations observed—buying pressure is being sustained.
Technical Overview
| Feature | Comment |
|---|---|
| Trend | Strong bullish trend, clean extension from 50/200 MA |
| Momentum | RSI above 70 is strong, but at risk of short-term exhaustion |
| Support | Initial: 6,320–6,350 zone; Deeper: 6,150 (50-day MA) |
| Candle Quality | Clean green bodies, no reversal patterns, healthy bullish stride |
Probabilities Table
| Scenario | Estimated Probability | Commentary |
|---|---|---|
| Continued grind higher to 6,500+ | 55% | Strong trend + RSI confirmation |
| Minor pullback to 6,320–6,350 | 30% | RSI cooling, profit-taking potential |
| Sharp correction to 6,150–6,200 | 15% | Needs external catalyst (e.g., macro or earnings shock) |
Trade Possibilities
For Bulls:
- Ride the trend, but watch for loss of momentum or RSI divergence.
- Trailing stops just under 6,320 offer reasonable protection.
For Bears:
- No valid short setup yet, but a gap up followed by intraday reversal could offer an entry point.
- Wait for signs like bearish engulfing or RSI divergence to initiate counter-trend setups.
Final Take
The S&P 500 futures are grinding higher along with all other US markets. The overbought RSI doesn’t offer much to worry about since the trend is slow and lagging.
Always remember to follow strict money management rules.
