

Introduction
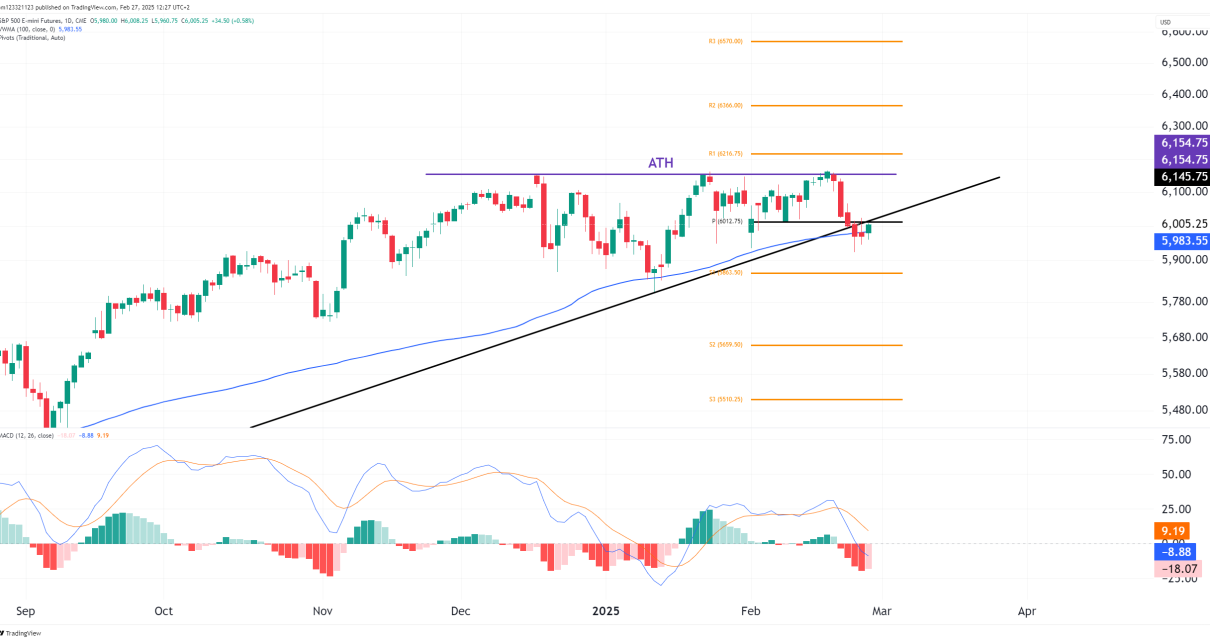
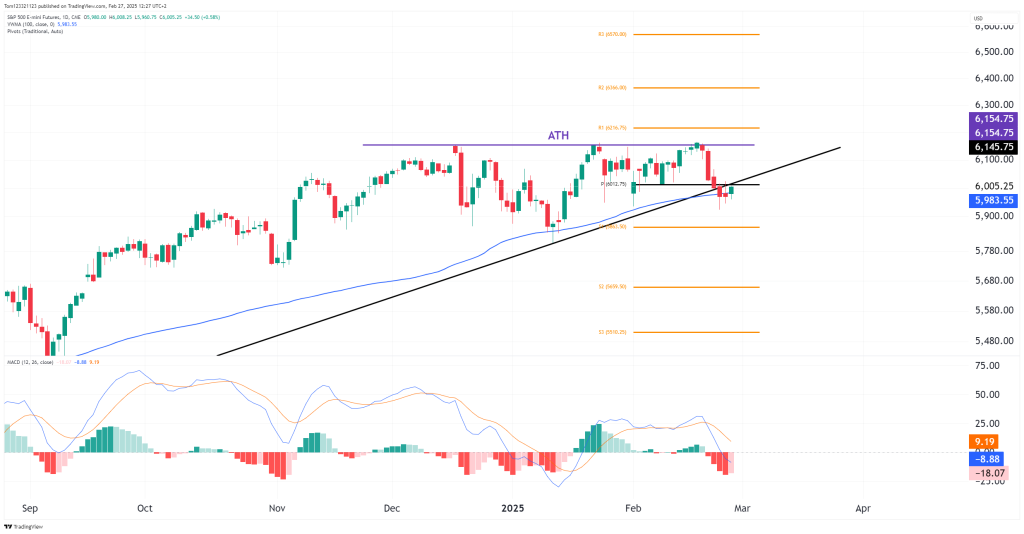
S&P 500 E-mini futures (ES) have broken below their rising trendline support, signaling a potential shift in market structure. After failing to break the all-time high (ATH) at 6,154.75, price has pulled back sharply, testing key support zones.
As of today, ES is trading at 6,004.75, up +0.57%, attempting to stabilize after a significant decline. The 100-day VWMA (5,983.55) is acting as immediate support, but bulls need to reclaim the trendline to regain momentum.
Market Drivers & Key News Events
- Fed Policy & Inflation Fears: Recent economic data suggests inflation remains sticky, causing uncertainty around the timing of interest rate cuts. This has led to profit-taking in equities and an overall risk-off sentiment.
- Earnings Season Volatility: While some tech giants have outperformed, broader market earnings have been mixed, weighing on sentiment.
- Technical Breakdown Adding Pressure: The break below trendline support has triggered further downside momentum, as traders react to a shift in structure.
Technical Outlook
Break Below Trendline—Key Levels to Watch
- Price has broken below the ascending trendline, a level that previously acted as support since late 2023.
- The 100-day VWMA (5,983.55) is now being tested, with a close below this level increasing downside risk.
- MACD has crossed bearish, confirming weakening momentum.
Key Support & Resistance Levels
- Resistance Levels:
- 6,154.75 (ATH – Key Resistance)
- 6,126.75 (R1 Pivot – Short-term Upside Target if Rebound Occurs)
- Support Levels:
- 5,983.55 (100-day VWMA – Must Hold for Bulls)
- 5,953.50 (S1 Pivot – Next Major Support)
- 5,859.50 (S2 Pivot – Deeper Correction Level)
If ES reclaims 6,126.75, buyers could regain control and push for another ATH test. However, a break below 5,953.50 increases the risk of a larger correction.
Momentum & Market Sentiment
- 100-Day VWMA is Being Tested: Losing this level could accelerate selling.
- MACD Bearish Crossover: Downward momentum is increasing.
- Trendline Break Signals Weakness: Bulls need to reclaim lost support to reverse this setup.
Sentiment has shifted neutral to bearish in the short term, but holding above 5,983.55 could provide a bounce opportunity.
Bull & Bear Scenarios
Bull Case: Recovery Above 6,126.75
- If buyers step in near the 100-day VWMA, ES could retest 6,126.75 and 6,154.75.
- A move back above the broken trendline would invalidate the bearish breakdown.
Bear Case: Continued Breakdown Below 5,983.55
- A confirmed close below 5,983.55 could send ES toward 5,953.50 or even 5,859.50.
- MACD suggests momentum favors further downside unless buyers reclaim key levels quickly.
Final Outlook
- Short-Term (1-2 Weeks): Bearish, unless price reclaims 6,126.75.
- Medium-Term (1-3 Months): Bullish as long as ES holds above 5,859.50.
- Long-Term (6+ Months): Still in an uptrend unless price falls below 5,800.
