

Introduction
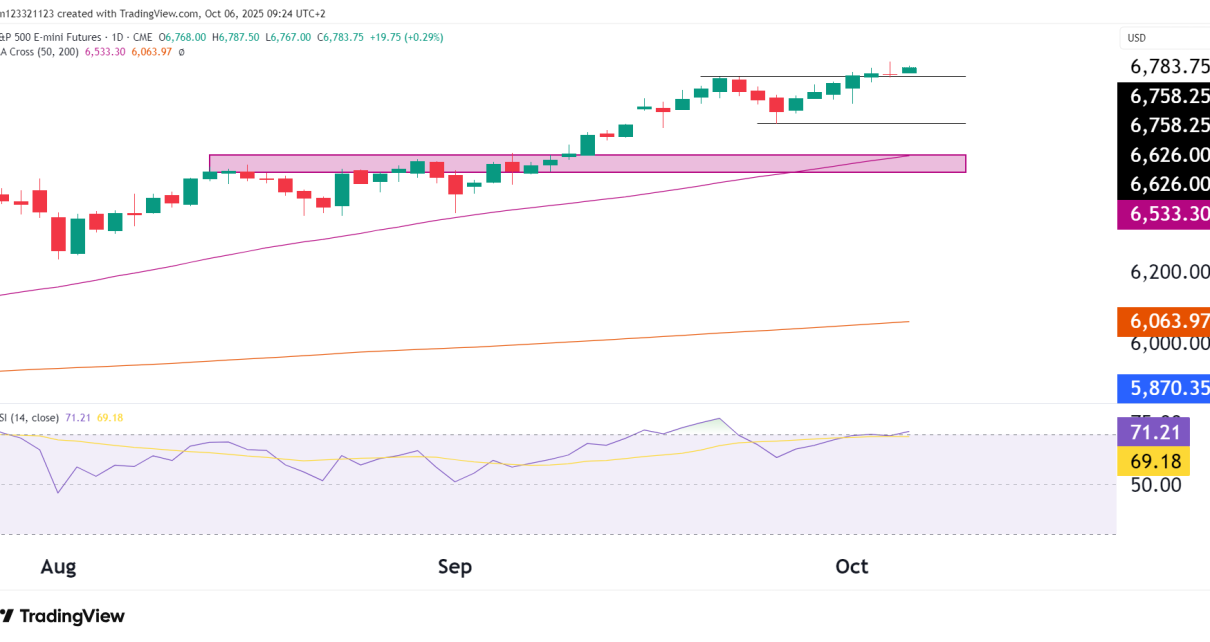
S&P 500 E-mini futures (ES) continue to make all-time highs, currently around $6,783, as buyers stay in control even as momentum starts to look stretched. The market is holding up well, moving sideways near the top of its recent range while traders keep an eye on strong earnings and smaller-ranged daily candles.
Technical Analysis
On the daily chart, ES is staying above the 50-day moving average at 6,533 and the 200-day at 6,063, which keeps the overall uptrend in place. Price hasn’t crossed below this level since the beginning of May this year. The old breakout area above 6,540 now acts as support, but price is well above it. The nearest support is at 6,628. Resistance is only really at 6,758, but price is already moving above it, and the trend is steady.
The RSI at 71.21 shows momentum is strong but a bit overbought, which means we could see a short pause or small dip before another move higher.
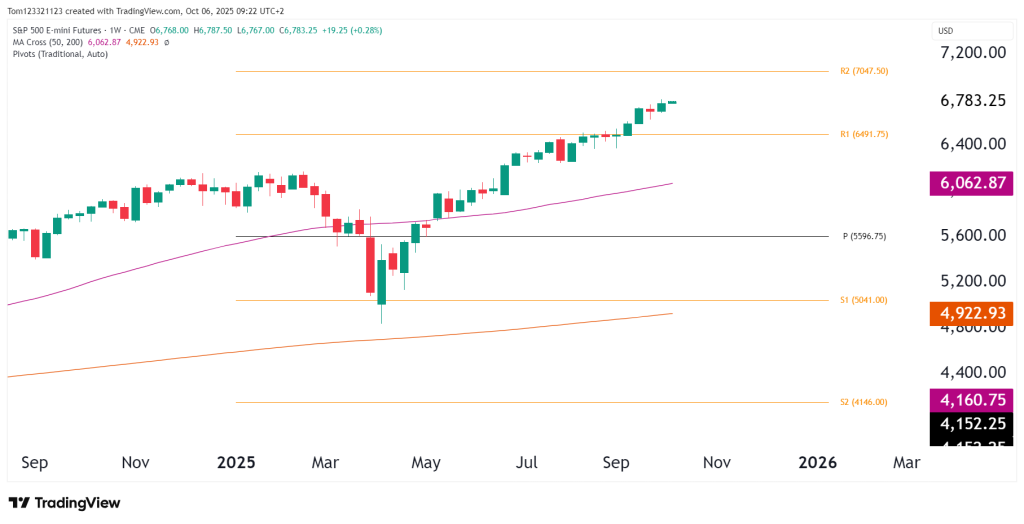
The weekly chart points to more upside. ES is slowly pushing toward the R2 pivot at 7,047, with the R1 level at 6,492 now a solid support. There are no signs of a reversal yet, so the trend looks intact.
Key Levels to Watch
- Resistance: 6,783 (current high), 7,047 (R2 weekly pivot)
- Support: 6,540 (breakout zone), 6,533 (50-day MA), 6,063 (200-day MA)
Probability Table
| Scenario | Estimated Probability | Notes |
|---|---|---|
| Consolidation near current highs | 45% | RSI is high; price might move sideways short-term. |
| Bullish breakout above 6,800 | 40% | Uptrend is strong; buyers could push it higher. |
| Pullback to 6,626–6,533 | 15% | Would be a normal dip within the trend. |
Fundamentals
The S&P 500 is still supported by a strong U.S. economy, slowing inflation, and strong company earnings. Investors and traders are hoping that the Fed is almost done raising rates, but Fed officials are still being cautious in their comments.
A strong U.S. dollar and sticky inflation in services could slow things down a bit. Also, global tensions and U.S. government issues might cause short bursts of volatility. But overall, the bigger picture still favors risk assets as long as growth holds up.
Summary
The uptrend is still strong, with support from both daily and weekly charts. Momentum is a bit stretched, but any dips above 6,533 (50-day MA) will likely be seen as normal consolidation. A breakout above 6,800 could open the door to 7,000–7,050 in the next few weeks.
This analysis is for educational and informational purposes only and does not constitute trading advice or a recommendation to buy or sell any futures contracts. Futures trading involves significant risk and may not be suitable for all investors. Always do your own research and speak with a licensed financial professional before making trading decisions.
