


Introduction
In the February 3 analysis, gold had a very big single-day sell-off of 13% after the price was hitting new highs consistently. The analysis we did was to see if there was a higher probability of the market continuing to fall or finding a base and slowly forming a recovery.
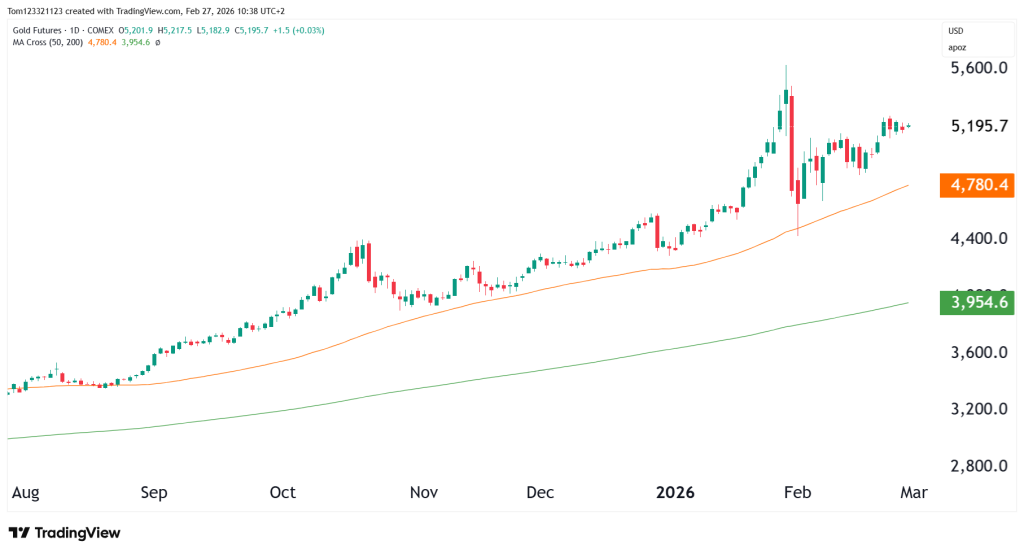
Since then, the bulls have found the strength to start pushing prices back upward, erasing roughly 75% of the pullback.
The correction now looks increasingly like a consolidation rather than a breakdown that would continue. It is likely that Gold was getting just too hot, and prices needed to stabilize and come back to the mean.
What Has Changed Since February 3?
Then:
- Slow gradual bullish strength returning
- Testing 50-day moving average (~4,450–4,500 zone at the time)
- Momentum stretched but bullish structure intact
The important level here was the 50-day moving average, which acted as a strong support level after the drop. If price remains above this, the trend is firmly bullish, and it is more likely than not that any pullback will get bought up.
Market Structure & Trend
Daily Chart

Importantly, the recent consolidation is occurring above prior breakout levels, not below them. That’s constructive. As already mentioned, the important level is the 50 day moving average. Volatility and general volume might be low for a while, too, as the market waits to see a clearer direction.
If you are on the side of the bulls, as more of the selling and profit taking occurs, and price holds, the more chance there is of price breaking above the all-time high again. Patience is key.
Key Technical Levels
Resistance
5,200–5,250:
Near-term resistance zone. A clean break and daily close above this level would likely open continuation toward 5,400–5,500.
5,500:
Psychological target if price discovery expands.
Support
4,950–5,000:
Short-term support and recent consolidation floor.
4,750–4,800:
Rising 50-day moving average. This remains the key trend support.
4,400–4,500:
Major structural support from prior breakout zone.
As long as gold holds above the rising 50-day MA, the bullish structure remains intact.
Looking Forward
Bullish Continuation (Primary Scenario)
Above 5,250 resumes price discovery toward 5,400–5,500.
Sideways Consolidation
Gold ranges between 4,950 and 5,250, allowing momentum to reset further before the next leg higher.
Deeper Pullback
Failure below 4,750 (50-day MA) opens a larger retracement toward 4,400.
Estimated Probability Table
| Scenario | Description | Estimated Probability |
|---|---|---|
| Bullish continuation | Break above 5,250 | 50% |
| Sideways consolidation | 4,950–5,250 range | 35% |
| Deeper pullback | Break below 4,750 | 15% |
Fundamentals to Watch
Gold tends to do well when real yields are falling or staying low. If the Federal Reserve signals a more dovish approach, that usually strengthens the case for higher gold prices. The U.S. dollar also plays a big role. When the dollar weakens, gold often continues higher, but if the dollar rallies strongly, it can slow gold’s upward momentum.
Central bank buying is another important factor. As more countries diversify their reserves, that steady demand supports gold over the long term.
Since gold is still trading near historic highs, upcoming inflation reports, comments from the Fed, and movements in Treasury yields will likely drive short-term price swings.
Final Takeaway
The pullback in February now looks like a normal pause, not the start of a bigger breakdown, giving the bulls a sense of relief.
Gold held its trend support, formed a higher low, and is now moving sideways just below its recent highs. The main trend is still up.
As long as the price stays above the rising 50-day moving average, dips are likely to attract buyers. The real question is not whether the uptrend is still in place, but whether gold is getting ready for another strong move higher.
Right now, the price is tightening into a narrow range. When markets compress like this, they often make a strong move soon after.
This analysis is for educational and informational purposes only and does not constitute trading advice or a recommendation to buy or sell any futures contracts. Futures trading involves significant risk and may not be suitable for all investors. Always conduct your own research and consult with a licensed financial professional before making trading decisions.
