


Introduction
Gold futures (GC) continue to push higher during the crisis in the Middle East as market participants scramble for safe havens. The yellow metal has been an outperformer this year as well as last, and there seems to be no signs of it stopping. Traders who have been looking to buy the dips have been well rewarded, and anyone trying to beat the market by shorting it would have to be extremely accurate to make any winners.
With all that is happening around the world, we would assume to see more volatility in GC, but it has been soft so far. Let us take a closer look at the technicals and what they are telling us.
Market Structure & Trend
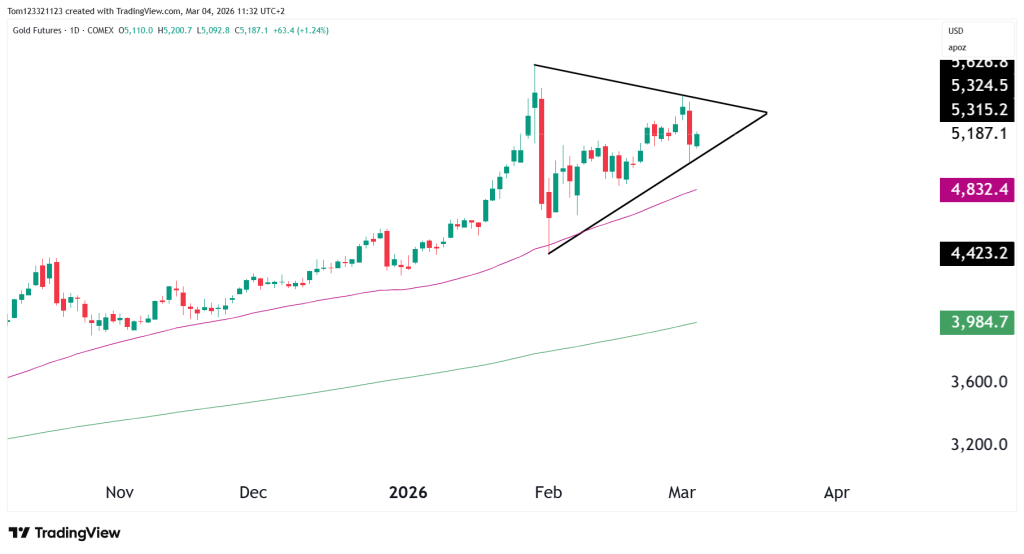
Daily Chart – Bullish Consolidation

The daily chart is forming a symmetrical triangle, a bullish break above the high could send the yellow metal surging past the previous all-time high, and may eventually lead to $6,000 Gold!
At the moment, however, all markets are fragile due to the ongoing crisis in the Middle East. It is recommended that all traders and investors take caution until there is clear peace talks. That being said, volatile times are where short-term traders can make big profits.
Long-Term Chart – Structural Bull Market
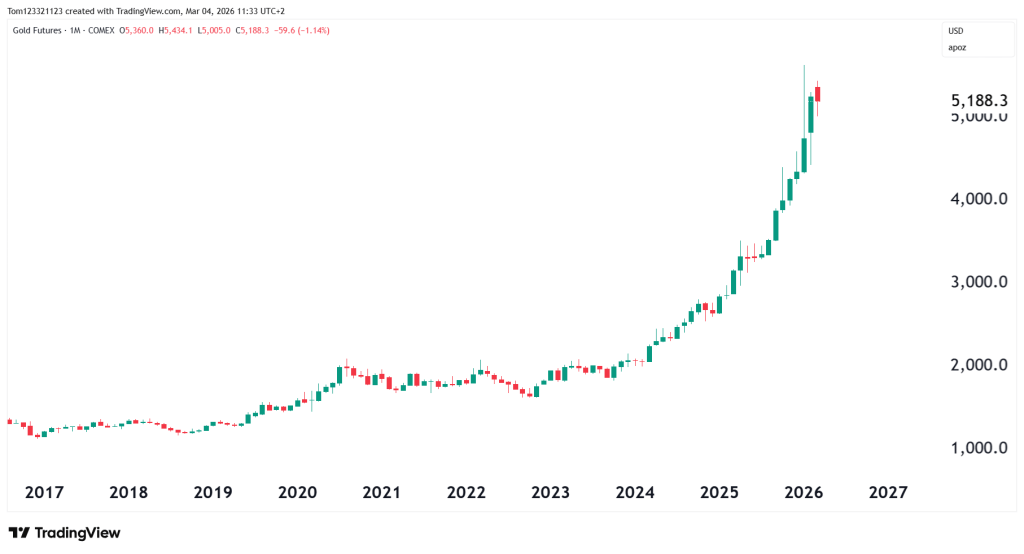
The monthly chart shows just how strong the rally has been. Since the start of 2024, there have been only 4 red closing candles, and they had a very small range and don’t classify as pullbacks.
Key Technical Levels for Gold
Immediate Resistance
$5,300 – $5,325
- Triangle resistance
- Recent swing high
- Breakout trigger for continuation
A strong daily close above this region would likely initiate the next impulsive move higher.
$5,600 – $5,650
- Projected triangle breakout target
- Psychological resistance
Support
$5,050 – $5,100
- Short-term consolidation support
- Area buyers recently defended
$4,830
- 50-day moving average support
- Important trend support level
If this level fails, momentum would likely shift toward deeper retracement.
$4,420
- Major structural support
- February capitulation low
A break below this level would invalidate the current bullish consolidation structure.
Scenarios Going Forward
Bullish Breakout
If geopolitical tensions remain elevated or escalate:
- Gold breaks $5,325
- Momentum traders enter
- Price targets $5,600–$5,800
Safe-haven demand could accelerate this move quickly.
Controlled Consolidation
Gold remains inside the triangle:
- Range between $5,050 and $5,300
- Continued compression
- Breakout later in March or April
This scenario would allow the market to cool momentum before the next leg.
Estimated Probability Table
| Scenario | Description | Probability |
|---|---|---|
| Bullish breakout | Move toward $5,600 | 45% |
| Consolidation | Triangle continuation | 35% |
| Deeper pullback | Retrace toward $4,800 | 20% |
Final Takeaway
Gold is still in a long-term uptrend, but right now the price is moving inside a triangle pattern. This usually means the market is building up for its next big move.
The key level to watch is $5,300. If gold breaks above that price, it could quickly move toward $5,600 or higher.
Traders should also pay attention to geopolitical news. Headlines about wars or global conflicts often cause sharp moves in gold, and that type of volatility may be returning.
Until gold breaks out of the triangle, the most likely scenario is that the price continues moving sideways within the pattern.
This analysis is for educational and informational purposes only and does not constitute trading advice or a recommendation to buy or sell any futures contracts. Futures trading involves significant risk and may not be suitable for all investors. Always conduct your own research and consult with a licensed financial professional before making trading decisions.