Introduction
Gold futures (GC) continue its bullish trend in an ascending channel on the weekly chart. However, on the daily timeframe, price action is consolidating, with mixed signals on whether a breakout or pullback is more likely in the short term.
Gold Fundamentals
Central Bank Policies & Interest Rates
- Federal Reserve: While the Fed remains cautious about inflation, recent comments from officials have been less aggressive on future rate hikes. This has weakened the dollar, providing support for gold.
- European Central Bank (ECB): The ECB’s hawkish stance and potential for higher rates in Europe have also influenced the gold market, as a weaker dollar generally benefits commodities.
Inflation & Safe-Haven Demand
- Inflation remains a concern globally, with gold acting as a hedge. Recent data showing persistent inflation has kept demand for safe-haven assets elevated.
- Geopolitical tensions and economic uncertainty continue to support gold, particularly as equities remain volatile.
Weekly Chart Analysis—Broader Trend Still Bullish
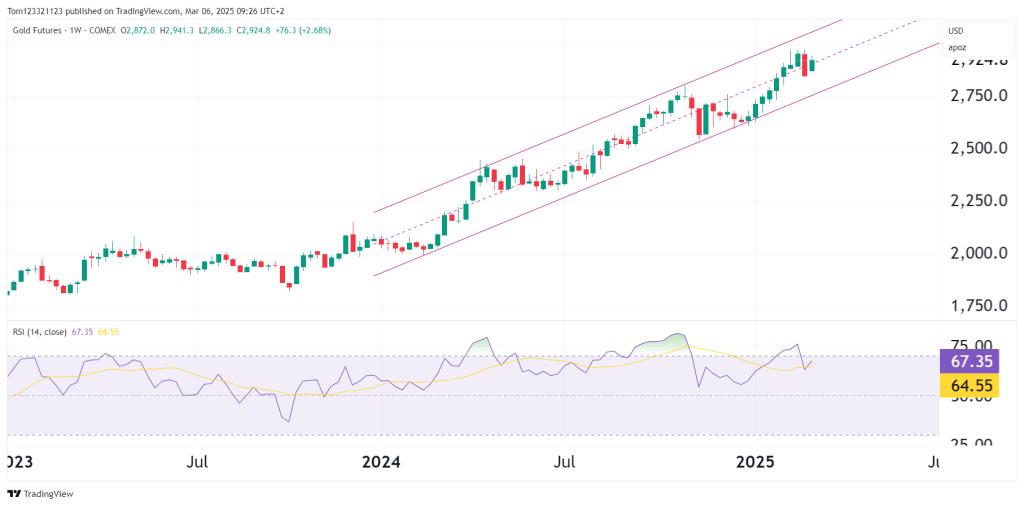
Key Levels to Watch
- Upper Channel Resistance: Currently around 3,000, a potential upside target if momentum continues.
- Channel Support: If a pullback occurs, the lower boundary of the channel offers support around 2,800.
Probabilities for the Coming Weeks
- The most probable scenario is a test of the upper channel resistance, given the strong uptrend.
- However, a pullback toward the middle of the channel is also likely if the broader market sentiment shifts.
Overall, the weekly trend remains bullish, with probabilities favoring higher prices unless the channel support is broken.
Daily Chart Analysis—Short-Term Trade Ideas
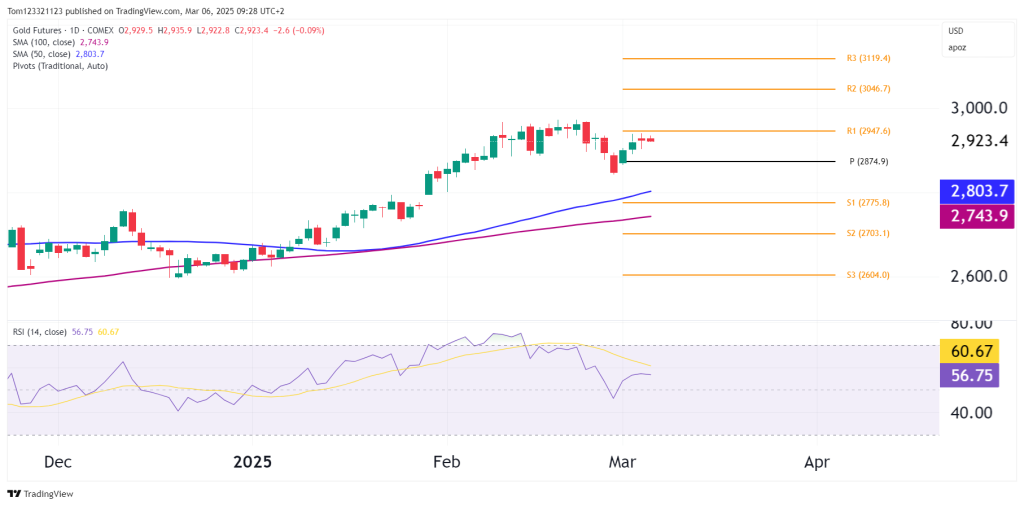
Price is consolidating below R1 (2,947.6), showing hesitation after a strong rally.The 50-day SMA (2,803.7) and 100-day SMA (2,743.9) are trending upwards.
Key Support & Resistance Levels
- Resistance Levels:
- 2,947.6 (R1 Pivot – Immediate Resistance)
- 3,000 (Psychological Level)
- Support Levels:
- 2,874.9 (Pivot Level – Key Short-Term Support)
- 2,803.7 (50-day SMA)
- 2,743.9 (100-day SMA)
A break above 2,947.6 could see gold pushing toward 3,000, while failure to hold 2,874.9 might result in a pullback to the 50-day SMA at 2,803.7.
Trade Ideas & Scenarios
Bull Case: Breakout Above 2,947.6
- Buy above 2,947.6, targeting 3,000, with a stop-loss below 2,874.9.
Bear Case: Pullback Toward 2,803.7
- If price fails at 2,947.6, consider a short position with a target at the 50-day SMA (2,803.7).
- The stop-loss should be placed above 2,947.6, limiting risk if the bullish trend resumes quickly.
Outlook Summary
- Short-Term (1-2 Weeks): Neutral to bullish, looking for a break above 2,947.6 or a pullback to 2,803.7.
- Medium-Term (1-3 Months): Bullish as long as gold holds above 2,743.9, with the potential for a push to 3,000.
- Long-Term (6+ Months): Still bullish on the weekly chart, with the ascending channel providing strong support and resistance guidance.