News
BlackRock has taken major steps toward launching a Bitcoin spot ETF, including listing the ticker symbol “IBTC” on the DTCC platform. The SEC has until January 2024 to approve or reject BlackRock’s ETF application. If approved, the ETF would significantly increase accessibility to Bitcoin investing for mainstream investors without dealing with crypto exchanges. This follows the approval of Bitcoin futures ETFs, signaling a more open stance by regulators. The DTCC listing and seed funding are common final steps before ETF launch, suggesting BlackRock may have received indications of likely approval. Bitcoin saw a surge to over $34k on the news.
The Bitcoin Halving
The bitcoin halving is an event every 4 years where the block reward miners receive is cut in half. With less new bitcoin being generated, supply issuance is reduced. This has led to a supply shock historically, as demand outpaces the new supply. With increased scarcity, bitcoin has entered into a bull market after previous halvings. The rallies after 2012 and 2016 produced new all-time high prices for bitcoin. Many anticipate the next halving in 2024 will kick off the next major bitcoin bull run. However, the halving’s impact on price relies heavily on the level of ongoing demand. If demand remains strong as supply issuance falls, the economics point to a rising bitcoin price.
Technical analysis
It has been 714 days since the bitcoin top as investors have painfully holding through a tough bear market. There is light at the end of the tunnel however and it appears that the next bull market is just over the horizon.
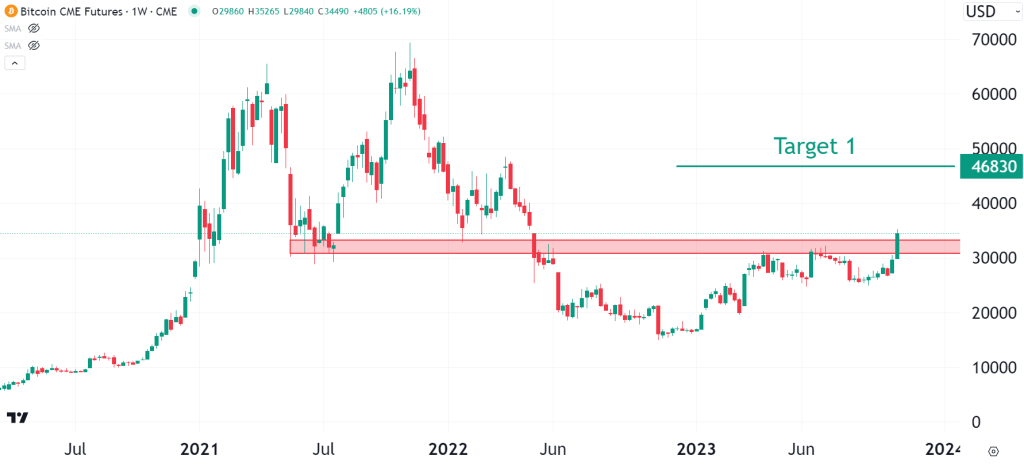
Weekly Chart
Price has broken above a resistance zone on the weekly chart that has been holding BTC down since April of this year. The resistance zone price is around $33,000. This may now act as support which means bulls could begin to load up on positions before the new bull market by accumulating in this zone. Targets would be $46,830 then all time highs after that.
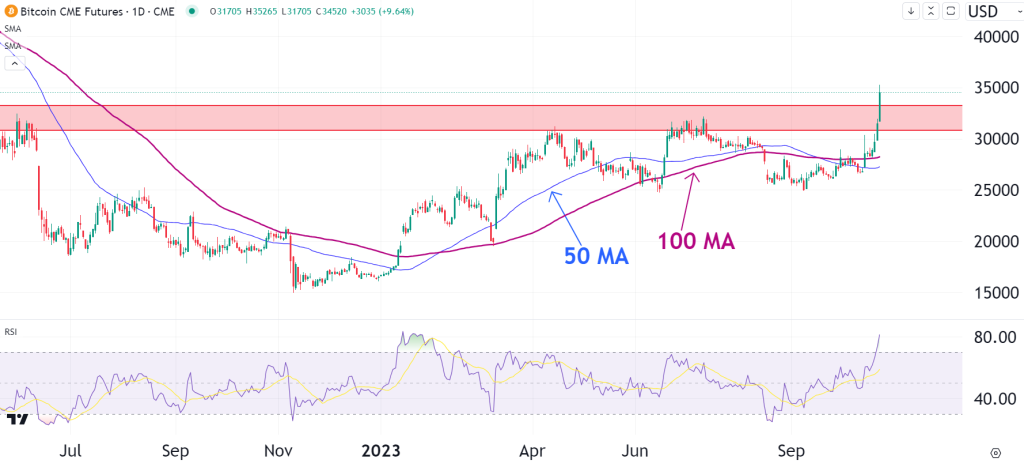
Daily Chart
The RSI is severly overbought at the moment printing 81.
The 50 and 100 moving averages have been flat for a while but the recent move may be causing them to turn upward. The 50 crossing above the 100 would be strong bullsih market signal for all traders.