

Introduction
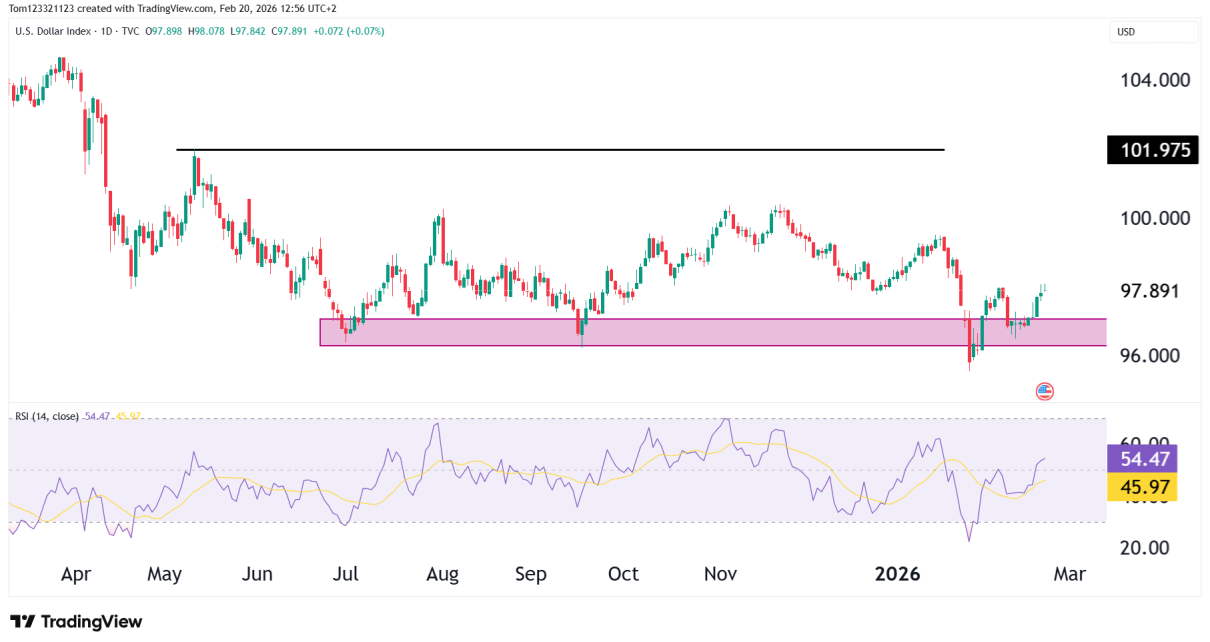
The U.S. Dollar Index (DXY) is attempting to stabilize after another rejection from the 101.90–102.00 resistance zone. Price recently swept below 96.00 before quickly reclaiming support in the 96.00–96.50 region — a level that has now held multiple times over the past several months.
Momentum has turned slightly constructive in the short term, but the broader structure remains range-bound.
Let’s break down what the chart is telling us.
Market Structure & Trend
Daily Chart
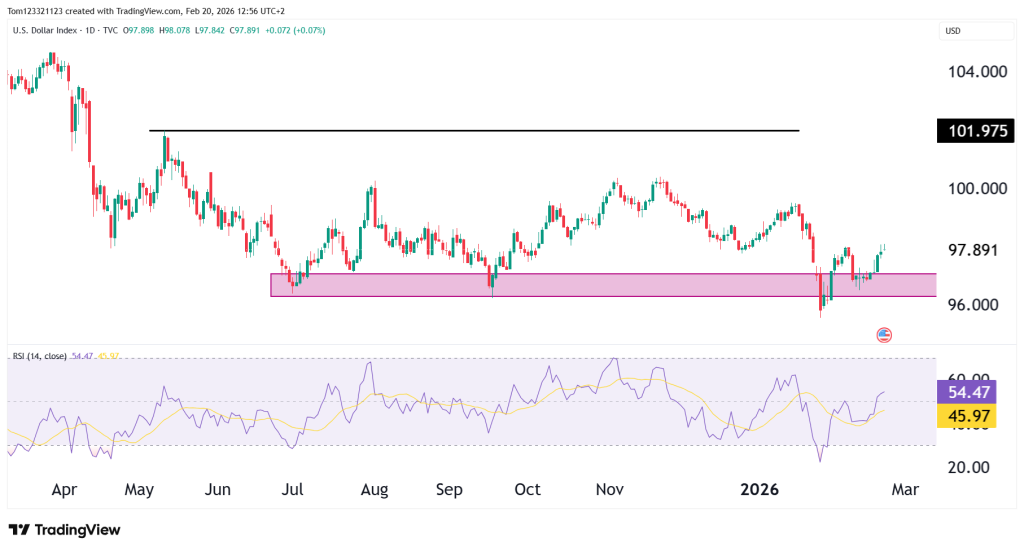
The daily timeframe shows a clear range environment:
- Major Resistance: ~101.90–102.00
- Major Support: ~96.00–96.50
DXY has repeatedly failed to sustain strength above 102.00, forming a series of lower highs since late 2025. At the same time, the 96.00 zone continues to attract buyers, producing strong bounces.
Most recently:
- Price swept below 96.00 (liquidity grab)
- Quickly reclaimed the support zone
- RSI rebounded from oversold and is now back above 50
RSI currently sits around 54, suggesting short-term momentum has shifted bullish, but not aggressively so.
This is still a range until proven otherwise.
Key Technical Levels
Resistance
99.50–100.00:
Intermediate resistance and prior supply zone. A break above here would likely open the door toward:
101.90–102.00:
Major range high and structural resistance. A clean daily close above 102.00 would signal a structural breakout and potentially initiate a larger trend reversal higher.
Support
96.00–96.50:
Major demand zone and multi-month support. As long as this level holds, DXY remains in consolidation rather than breakdown.
94.50–95.00:
If 96 fails decisively, this becomes the next downside magnet.
Looking Forward
Bullish Range Rotation
Holding above 96.00 allows DXY to rotate back toward 99.50–100.00. Momentum supports this scenario in the short term.
Continued Consolidation
Price remains trapped between 96 and 100, with neither side gaining control. This would keep cross-asset markets in rotational mode.
Bearish Breakdown
A sustained break below 96.00 could trigger acceleration toward 94.50 or lower, potentially shifting macro dynamics across equities, commodities, and rates.
Estimated Probability Table
| Scenario | Description | Estimated Probability |
|---|---|---|
| Bullish rotation | Move toward 99.50–100.00 | 40% |
| Sideways consolidation | Continue 96–100 range | 35% |
| Bearish breakdown | Sustained break below 96 | 25% |
Macro Drivers to Watch
The dollar is highly sensitive to macro expectations. Key catalysts include:
1. Federal Reserve Policy Expectations
Shifts in rate cut timing or hawkish rhetoric typically support DXY. Dovish surprises weaken it.
2. U.S. Treasury Yields
Rising real yields tend to push the dollar higher. Falling yields pressure it.
3. Inflation Data (CPI / PCE)
Hot inflation → stronger dollar via rate repricing.
Soft inflation → weaker dollar via easing expectations.
4. Risk Sentiment
In risk-off environments, the dollar often benefits as a safe-haven asset.
Final Takeaway
DXY remains range-bound but is attempting a short-term bullish rotation after defending the 96.00 zone.
The key question now:
Does this bounce expand toward 100+ —
or fail beneath 99 and roll back toward support?
Until 102 breaks decisively, this remains a consolidation structure rather than a confirmed trend.
This analysis is for educational and informational purposes only and does not constitute trading advice or a recommendation to buy or sell any futures contracts. Futures trading involves significant risk and may not be suitable for all investors. Always conduct your own research and consult with a licensed financial professional before making trading decisions.
