

Recap from the Previous Report
In our April 17 technical analysis, we focused on the bounce we saw off the lows in ES, with a breakout attempt through trendline resistance. We can now take a fresh look at the price action and see what could be ahead.
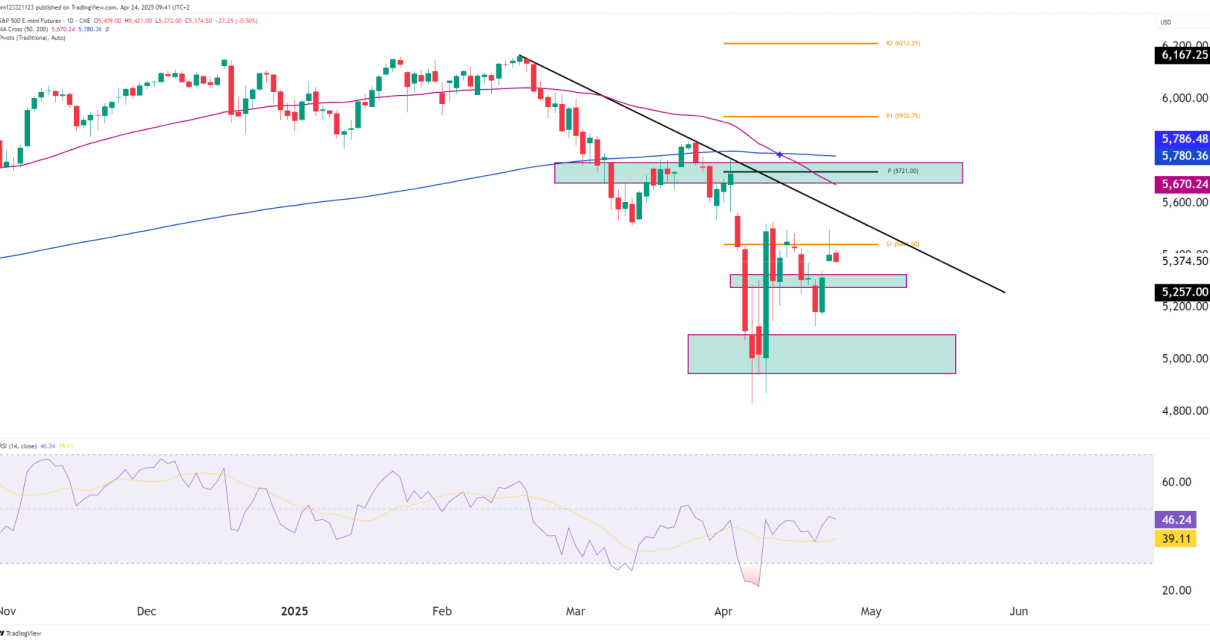
Current Chart Overview (April 24, 2025)

Market Snapshot
- Current Price: 5,374.50
- Change Today: −27.25 (−0.50%)
- Key Resistance: 5,670 – 5,720 zone
- Key Support Zones:
- First: 5,257 (recent base)
- Second: 5,000 – 5,100 (volume support cluster)
Support Zones Holding (for now)
- The 5,250–5,275 area acts as a small base of support, above the major 5,000 level below.
- Breakdown below here could open the trapdoor toward:
- 5,000 – 5,100: Previous bounce zone.
- Psychological level at 5,000
ES Bullish Case (Fading, but Possible)
- A surprise reclaim of 5,720 and the trendline would flip the narrative quickly.
- In that case, 5,952 (R1) would be the target followed by 6,167 (R2) if the macro tone improves (e.g. Fed dovish pivot or earnings surprises).
- RSI would need to turn back up and MACD should reconfirm a bullish cross.
ES Bearish Case (Dominant Narrative)
- Rejection at the trendline and 50/200-day MAs confirms downside control.
- Break of 5,257 would complete a bear flag breakdown and open downside momentum.
- Targets:
- First leg: 5,100
- Second leg: 5,000–4,950
This aligns with broader macro risk-off sentiment (rising yields, trade tensions, sticky inflation).

ES Summary Table
| Technical Element | Status | Implication |
|---|---|---|
| Trendline & MAs | Rejected | 🔻 Bearish pressure holds |
| RSI | Rolling over | ⚠️ Momentum fading |
| Support (5,257) | Holding (barely) | ⚠️ Key inflection level |
| Price Structure | Lower high | 🔻 Trend intact |
| Volume/Conviction | Declining on rally | ❌ Weak bullish follow-up |
Final Take
| Timeframe | Bias | Trigger to Watch |
|---|---|---|
| Short-Term | Bearish | Break of 5,257 support |
| Medium-Term | Bearish | Confirmed lower high |
| Long-Term | Neutral–Bullish | Only above 5,720 & 6,000 zone |
Conclusion
Until price closes above 5,720, this bounce looks more like a bear market rally than a genuine recovery.
Keep an eye on macro headlines (especially Fed commentary) and earnings season volatility. If the bulls don’t step in here, the door to 5,100 and 5,000 will swing wide open.
