

Introduction
The recent rally in U.S. equity markets, particularly the NASDAQ, has been fueled by the Federal Reserve’s decision to cut its benchmark interest rate by 50 basis points in September 2024. This dovish monetary policy has pushed equities higher. It is as simple as that, traders and investors simply follow the Fed now regardless of economics, earnings, or even if there are wars raveging the earth.
Let’s look at the technicals.
Key Technical Insights
Price Action and Trendlines:
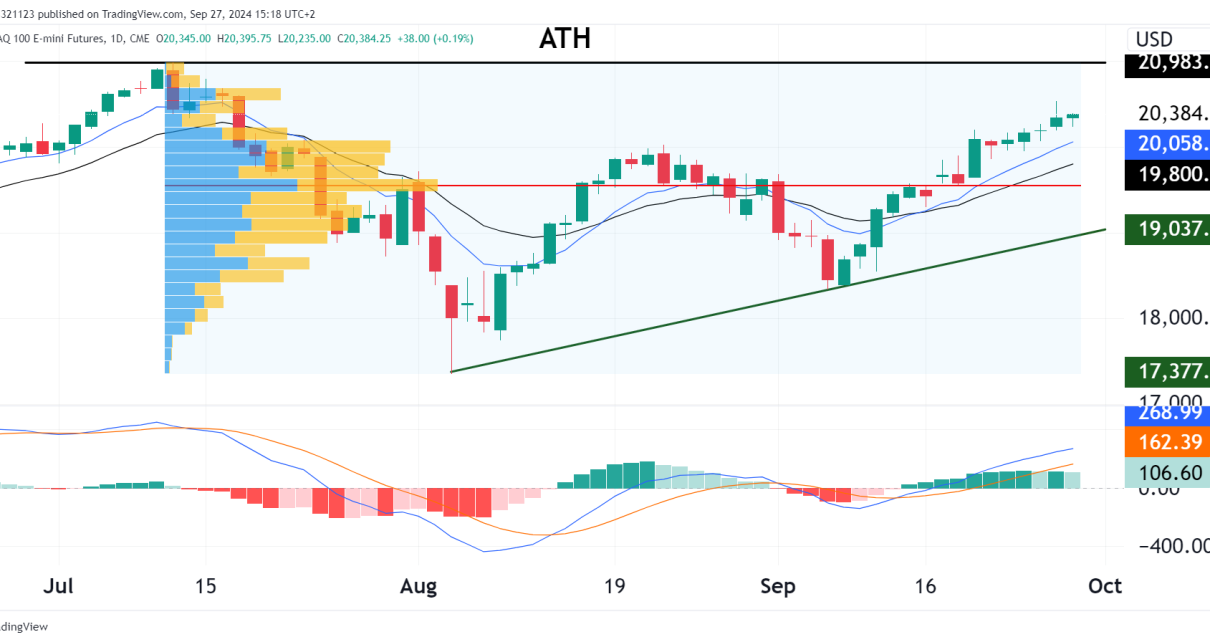
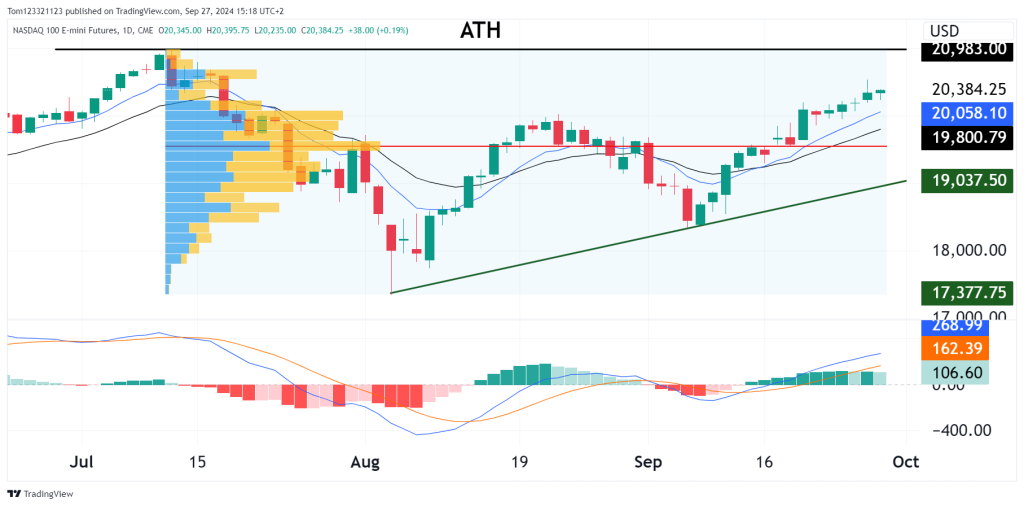
- Ascending Trendline: The green ascending trendline starting from the lows in late August gives hope for continued higher highs to form. This trendline provides a level of support, and any retest of this line could be a good buying opportunity.
- All-Time High (ATH) Resistance: The price is nearing the ATH at $20,983. If price breaks this level with strong momentum, it means the next leg of the bull market is on.
Volume Profile:
- High Volume Node: The price range between $19,800 and $20,058 has significant trading volume, meaning this area could act as a key support zone. Should price retrace to this level, it would likely provide a strong buying opportunity before resuming the uptrend.
MACD Indicator:
- Bullish Momentum: The MACD has a bullish crossover (blue line above orange), and the histogram is expanding above the zero line.
Potential Trade Setup
Bullish Scenario
Breakout Play:
- A breakout above the ATH resistance ($20,983) with strong volume could signal a continuation of the bullish trend.
- Trade Idea: Enter long on a confirmed breakout above $20,983, with a short-term price target of $21,500 and a stop loss just below the breakout point at around $20,750 to manage risk.
Pullback Buy:
- If the price retraces to the high-volume area between $20,058 and $19,800, this could present a strong buying opportunity for traders looking to enter at a lower risk point.
- Trade Idea: Buy on a pullback to this zone, with a target of retesting the ATH near $20,983 and a stop loss slightly below $19,700.
Conclusion:
- Short-term (1-2 weeks): Bullish, targeting a breakout to new all-time highs. Watch for a breakout above $20,983 or a retracement to $20,058 for an entry point.
- Medium-term (1-3 months): As long as price remains above the trendline and major support at $19,800, the medium-term trend remains bullish.
- Long-term: If price breaches the ATH with volume, the long-term outlook becomes even more bullish, with potential for much higher gains.
OneUp Trader Beginner Trading Course
If you want to learn to do technical analysis just like this, you can sign up or the beginner trading course recently launched for a 50% discount!
