

Oil prices increased slightly on Thursday as US inventory data surprised to the upside, indicating better-than-expected demand. At the same time, investors lowered their expectations for an increase in production at OPEC’s June meeting. WTI, Crude inventories (Source: Bloomberg, EIA) Notably, data on Wednesday revealed that US crude inventories fell by 1.4 million barrels last Read More…
Year: 2024
E-Mini Russell 2000 Index Futures Technical Analysis
RTY Chart Overview In this analysis, we’ll take a closer look at the daily chart of the E-Mini Russell 2000 Index Futures, focusing on the potential head and shoulders pattern, support zone, and key technical indicators. Head and Shoulders Pattern The chart highlights a possible head and shoulders pattern, which could lead to a bearish Read More…
Gold Prices Ease But Outlook Remains Bright
Gold prices pulled back on Tuesday as investors paused and took profits after the recent rally. However, the bullish bias remains as markets cheered the increased likelihood of a Fed cut in September. At the same time, central bank purchases kept demand high. The pause in gold prices might be temporary, as most indicators point Read More…
Asian Markets Soar as U.S. Rate Cut Hopes Fuel Optimism
MSCI Index Rises and Hong Kong’s Hang Seng Extends Winning Streak The MSCI’s broadest index of Asia-Pacific shares outside Japan saw a slight increase in early trade, while Hong Kong’s Hang Seng index, despite a slight dip, has witnessed an impressive 14% rise over a 10-day winning streak, the longest since 2018. Japan’s Nikkei index Read More…
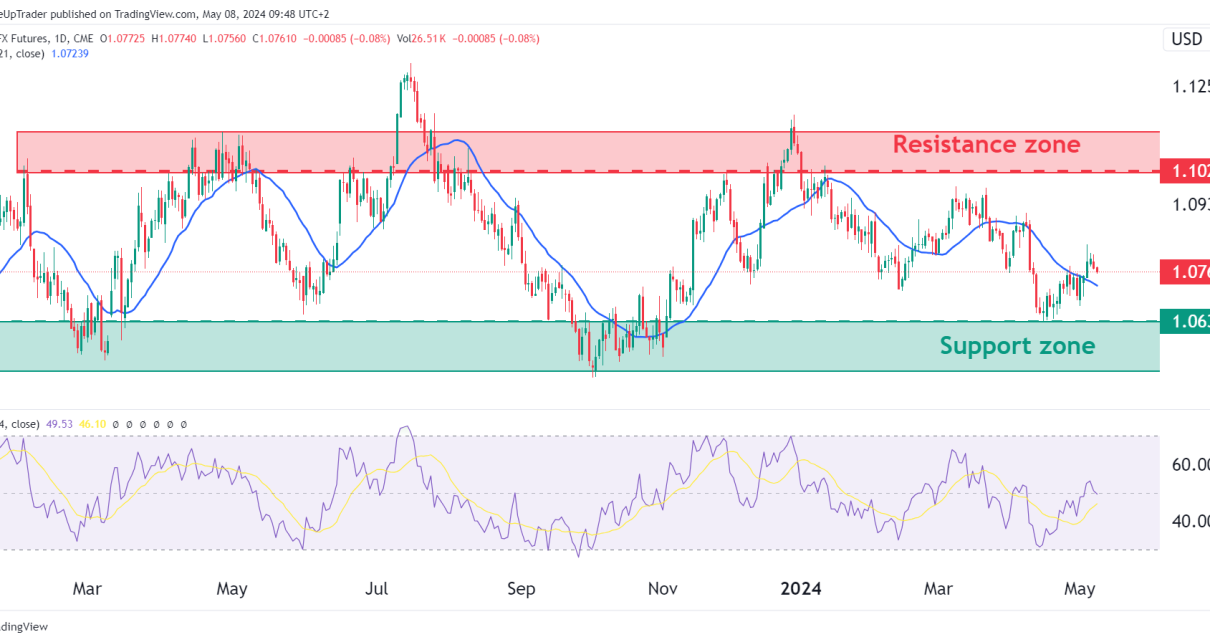
Euro FX Futures Technical Analysis
Chart Overview In this analysis, we’ll take a closer look at the daily chart of the Euro FX Futures, focusing on the price movements as 6E has been stuck in a range for over one year. This range is between well-defined support and resistance zones, with the resistance zone at 1.10265, and the support zone Read More…
Equities Soar on Fed Rate Cut Optimism
Equities closed higher on Monday as investors gained confidence that the Federal Reserve will cut rates sometime this year. Moreover, better-than-expected earnings reports from US companies continued to support the market. S&P 500 (Source: Bloomberg) Since last week, equities have performed well as policymakers and economic reports point to an eventual Fed rate cut this Read More…
S&P 500 Futures (ES) Technical Analysis: Bulls Are Back
S&P 500 Chart Overview In this analysis, we’ll dive into the daily candlestick chart of the S&P 500 E-mini Futures, focusing on the technicals and chart patterns as ES bulls make a return. ES is up 5% since its low from April and the selling pressure appears to be weaking more and more. Price Action Read More…

Jack Says OneUp Trader is a Leading Funded Trader Program
Jack S, a futures trader, recently shared his experience with OneUp Trader on Trustpilot, a funded trader program. In his review, Jack highlights several key aspects that make OneUp Trader stand out from the competition. Firstly, Jack points out that the company offers a competitive pricing structure. He states that the pricing is a “REAL Read More…
Currency Futures Surge as Dollar Plunges on Poor Jobs Report
Currency futures surged on Friday as the dollar plunged after a poor jobs report. The report revealed a deterioration in the labor market that led to an increase in Fed rate cut expectations. At the same time, data from the US showed a decline in service sector activity, weighing on the dollar. US employment data Read More…
Crude Oil Futures (CL) Shift From Bullish to Bearish
Overview In this analysis, we’ll take a closer look at the CL futures chart, which displays daily price action along with several technical indicators, including a Simple Moving Average (SMA), Pivot Points (traditional, automatic setting), and the Relative Strength Index (RSI). CL Technical Analysis Trend and Price Action Prices were in an uptrend from February Read More…