

Introduction
As the U.S. Dollar Index (DXY) rallies toward key resistance levels, traders and analysts are closely monitoring whether this move will mark a sustained bullish breakout or a temporary reprieve in the broader downtrend that has characterized much of 2024. The index, which measures the greenback against a basket of major currencies, has experienced a notable resurgence in recent weeks, but with momentum indicators flashing warning signs, the coming days could prove pivotal.
Symmetrical Triangle
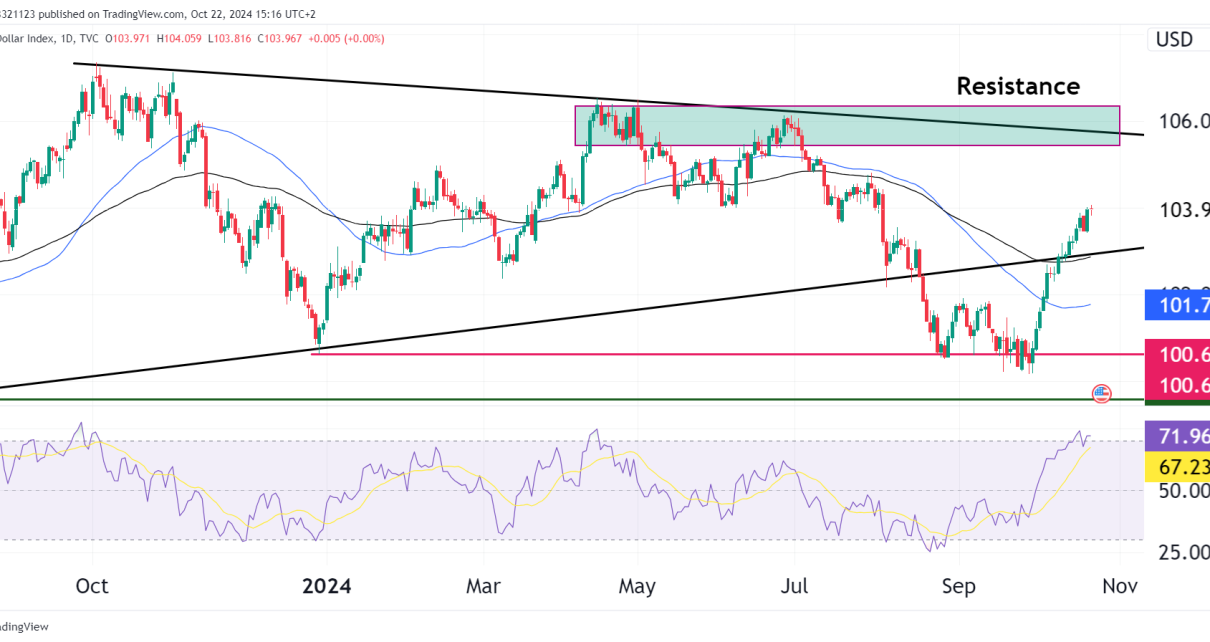
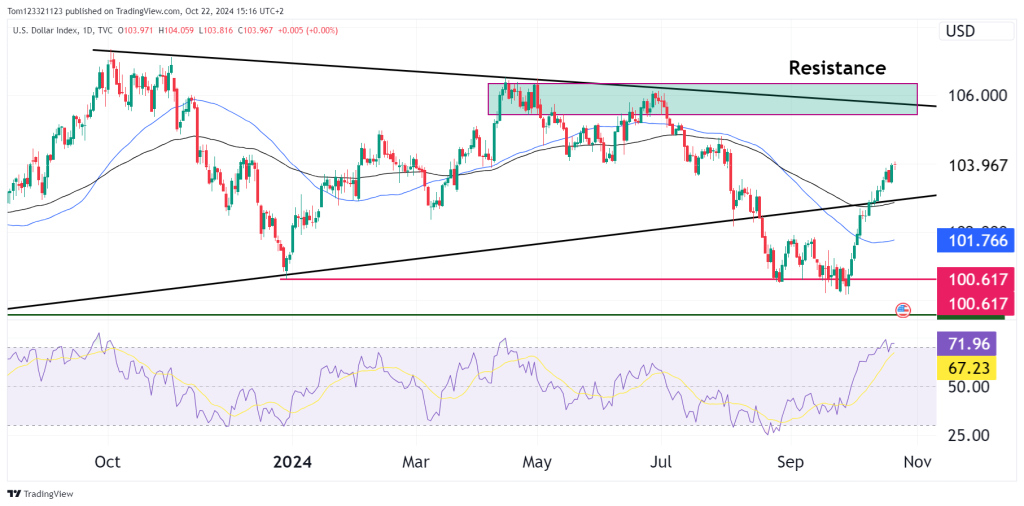
A long-term symmetrical triangle pattern, has been in play for much of 2023 and 2024. The index now approaches the apex of this pattern, where price action is squeezed between rising support and descending resistance lines. The price had broken below the support level, but the bulls stepped back in and have now shot the price back up into the triangle range.
On the upside, the 106.00 level is the most prominent resistance zone. This level, which previously capped the dollar’s advance in early 2024, sits directly along the descending upper trendline of the triangle. A breakout above this threshold could trigger significant technical buying, as such moves are typically viewed as a strong bullish signal.
Conversely, failure to breach the 106.00 level could reinforce the triangle’s constraining nature, resulting in a deeper pullback. In particular, a retreat toward the lower boundary of the triangle, currently situated around 101.76, would put pressure on the index to maintain its upward trajectory.
The Relative Strength Index (RSI) has surged into overbought territory, now sitting at 72.32. This tells us that there is a likely chance of a consolidation phase which is reinforced by the fact that there was a strong rally with only 1 red session in the past 17.
Support Levels to Watch
Should the dollar fail to sustain its current momentum, key support levels will come into focus. The 101.76 level has acted as a floor for the dollar in recent months, and a move below this level could signal a more pronounced shift in sentiment. Beneath that, the 100.61 level provides a final line of defense before more significant downside risks emerge. A drop through these support levels could confirm a bearish breakdown from the symmetrical triangle, leading to a potential retest of earlier lows.

