

Introduction
Since the prior analysis conducted in mid-September, the bearish double-top formation has played out as predicted.
Price Movement Since September 11
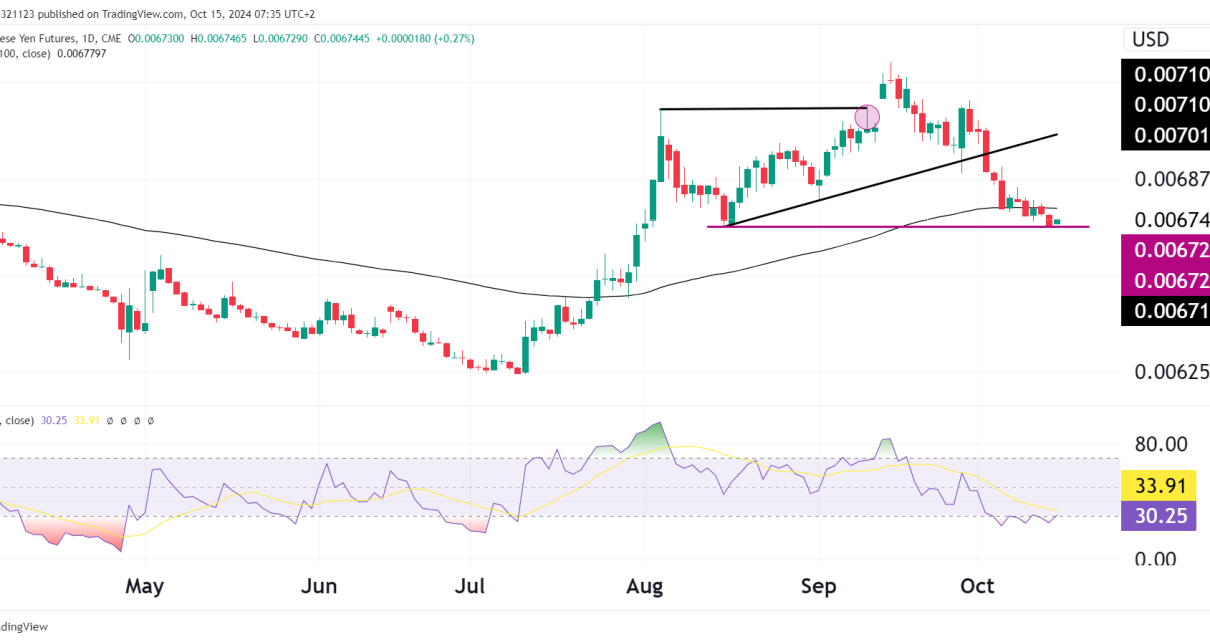
- The price failed to sustain itself above the 0.0071010 resistance level, which aligns with the previously discussed double top formation. After the price touched this level, there was a clear reversal. The double top pattern has now been confirmed as valid.
- The price has broken below the rising trendline that was supporting the ascending triangle pattern mentioned in the prior analysis. This confirms the bearish sentiment that was flagged earlier.
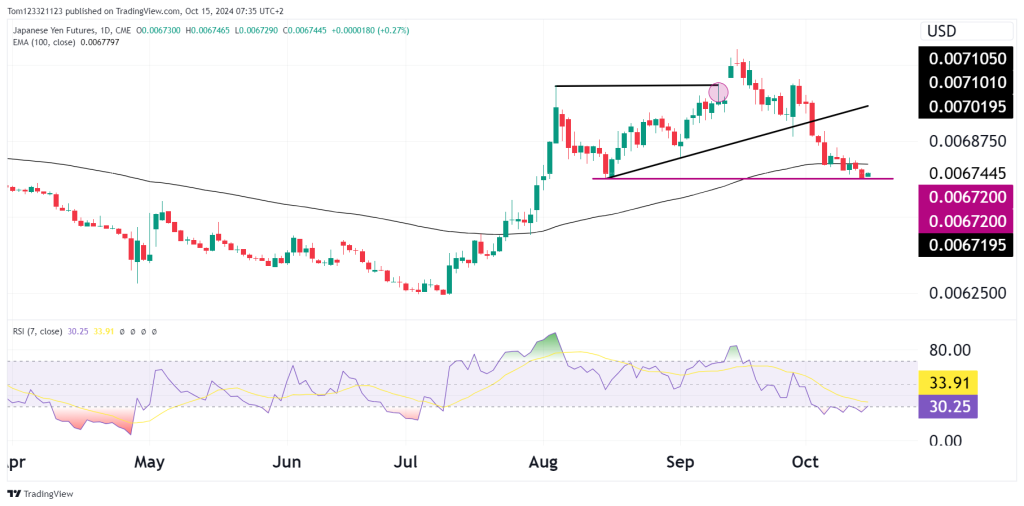
- Also what is important to note is the purple line on the chart which is the last support for bulls which is also around the 100 simple moving average line. If we see price drop below this level, it is likely price could reach lows of 0.00625.
RSI (Relative Strength Index)
- The RSI is currently oversold. This could lead to some short-term buying pressure as traders look for a bounce, particularly near key support levels. However, the bearish momentum remains strong.
- Given the oversold condition, there is potential for a relief rally, but it would likely be temporary unless there’s a decisive move above the key resistance levels.
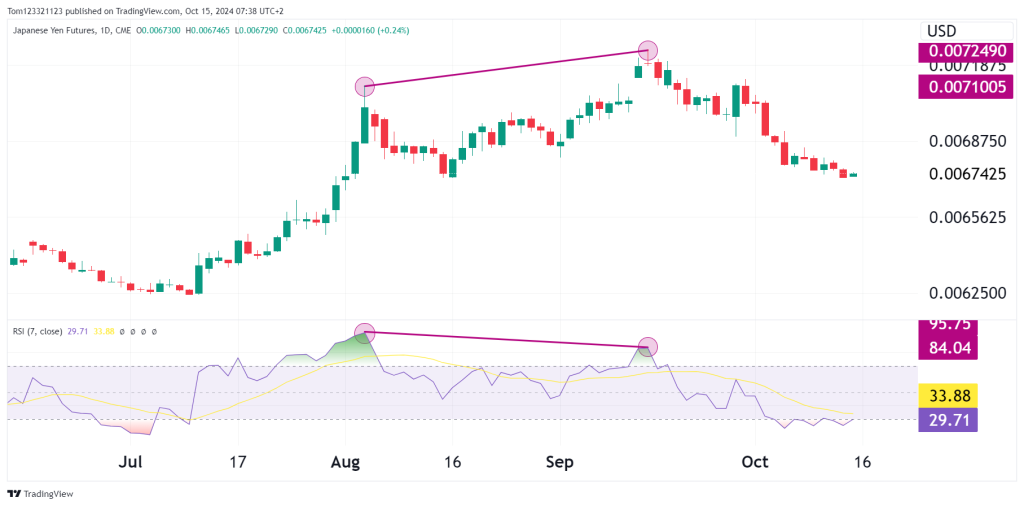
- Take note of the bearish divergence from earlier on. Bearish divergence is a high-probability pattern that, if used correctly, can be a powerful tool. Learn more about how to use this in our beginner trading course.
Short-Term Outlook:
- Bearish: The confirmation of the double top and the bearish price action since September signal continued downside pressure. In the short term, watch for a potential bounce due to oversold RSI, but the trend remains bearish unless price can break back above the 0.0067410 level or retake the 100 EMA.
- Price Target: Downside targets remain at 0.0065625 in the short term, with a possible extension toward 0.0062500 if selling pressure persists.
Medium-Term Outlook:
- Bearish to Neutral: The break below the neckline and the failure of the ascending triangle formation suggest that bearish momentum could dominate in the medium term. The price could potentially test the lower volume profile support near 0.0062500.
- However, there could be a period of consolidation in the 0.0065625 to 0.0067410 range as buyers and sellers battle for control.
Final Call:
- Short-term: Bearish (with a potential short-term bounce due to oversold RSI).
- Medium-term: Bearish to Neutral.

