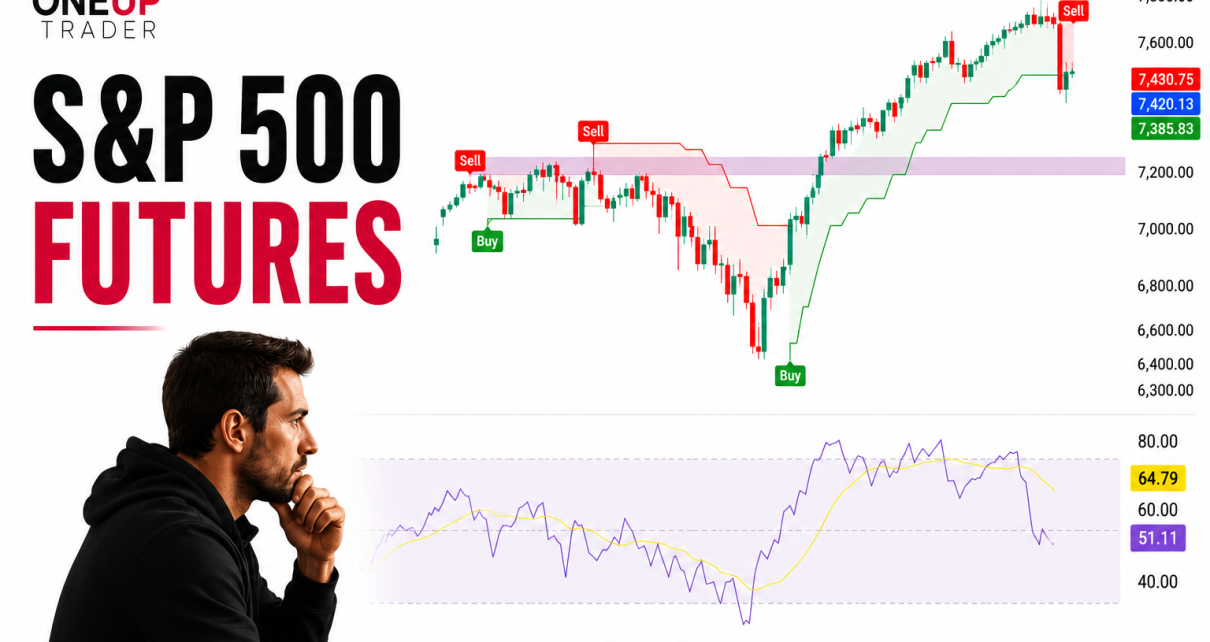
Monthly Chart Analysis:The long-term monthly trend has revealed a downward pressure since its peak around 2020. However, recent candles suggest a potential stabilization. The Momentum indicator has dropped into negative territory, which tells us there is a slowdown in the selling pressure. Daily Chart Analysis:Price action has settled around key moving averages as the battle Read More…
Tag: stock market
NASDAQ Futures (NQ) Hit New ATH: Technical Analysis
Like most markets around the world at the moment, US equities are on a tear, especially after the rate data yesterday. It is really difficult to find a bearish opportunity in this market, which points us in the direction of ‘the trend is your friend’. Daily Chart:The market is trading within a rising channel, showing Read More…
Bitcoin pulls back, bulls buy it back: Technical Analysis
Daily Chart:A potential reversal candle is forming after the recent downturn we have seen in Bitcoin. The Awesome Oscillator shows a decrease in momentum, highlighted by the shrinking green bars turning red. BTC has been on a tear, up over 50% for the year. A pullback was going to come eventually but the question is Read More…
Equities Rally on the Strength of Mega-Cap Giants Alphabet and Tesla
Equities closed Monday in the green after a rally in mega-cap stocks like Alphabet and Tesla. However, there was caution as investors looked forward to the FOMC policy meeting, which will affect rate cut expectations. The rally in mega-cap stocks came due to several factors. However, the main one was AI optimism. Notably, Nvidia soared Read More…
S&P 500 E-mini Futures Technical Analysis
Weekly Chart Analysis:ES is trading above its weekly pivot point, with immediate support at 4492.00 USD. The RSI is in the overbought territory, showing strong bullish momentum. The next resistance levels are R1 at 5169.50 USD and R2 at 5519.00 USD. Daily Chart Analysis:A potential bearish divergence is creating some worry for bulls as the Read More…
Crude Oil Futures (CL) Technical Analysis
Crude Oil Weekly Chart The weekly shows significant support around the $67 level, which has been tested multiple times since mid-2021, establishing it as a ‘Huge Support’ zone. The volume profile on the left shows a lot of trading activity around these levels, painting the point of control within that support zone. Bears have not Read More…