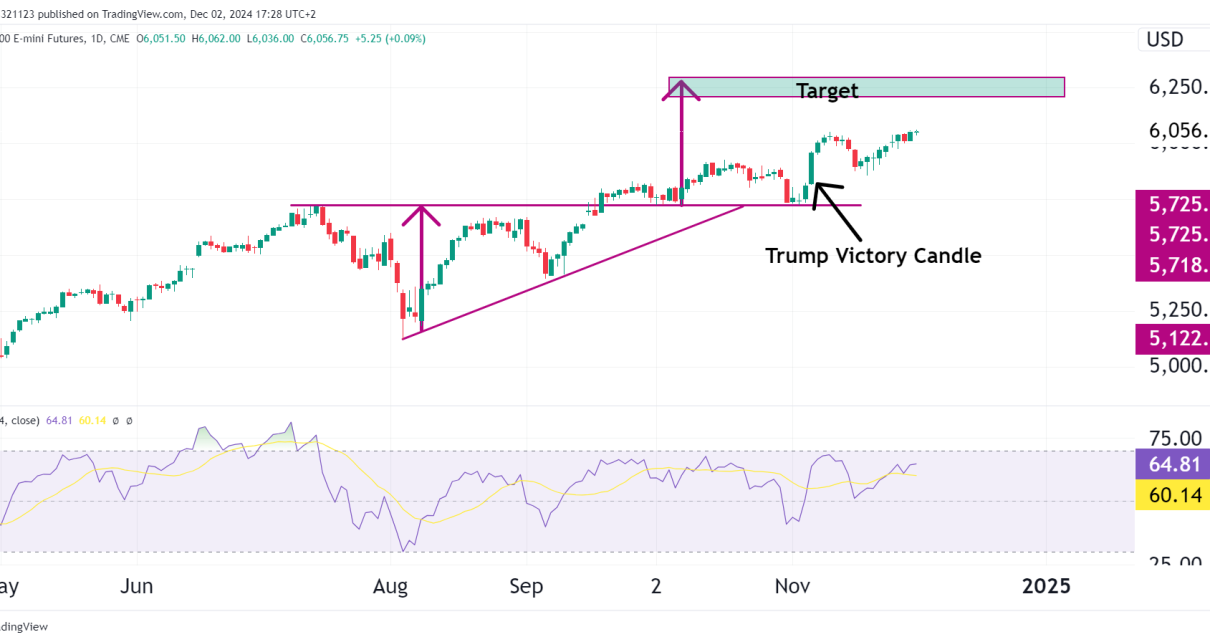
Equities ended lower on Monday as Nvidia fell ahead of its earnings report. However, rate-cut optimism lingered after Powell’s dovish speech on Friday. Meanwhile, investors were gearing up for the core PCE report for more clues on the outlook for Fed rate cuts. As investors worried about the upcoming earnings report, Nvidia lost 2.25% of Read More…
Tag: stock market
Will Gold Breach ATH Again?
Introduction Gold futures have continued their steady run upwards, boasting an impressive 31% return over the past year. The question is whether we see this trend continuing. Technical Analysis The daily chart shows us the 50-moving average positioned well above the 100-moving average. There is also a flag formation where gold sat sideways since the Read More…
Crude Oil Futures (CL) Double Bottom In!
Introduction A few days ago, we looked at CL, which was approaching a significant support zone at $72 per barrel. Price continued to fall and hit the support zone and bounced out with strength as bullish buy pressure surged. The daily chart now has a double bottom and a bullish candlestick pattern printed on it that Read More…
Gold Dumps as CPI Increases, Technical Analysis Still Bullish
Recent News US Economic Data: The release of the US Consumer Price Index (CPI) data on August 14 showed a slight increase, which led to fading expectations of an imminent rate cut by the Federal Reserve. This resulted in a minor decline in gold prices, as the likelihood of a rate cut, which would weaken Read More…
How This Funded Trader Profits From Support & Resistance
Trading Strategy Overview Josh, a trader from Connecticut, has received funding in OneUp Trader’s funded trader program by employing a straightforward support and resistance trading approach. His strategy focuses on identifying key levels on the chart and profiting on breakouts and retracements. Many traders use support and resistance levels in their approach, but Josh has Read More…
NASDAQ 100 (NQ) Trade Opportunities
Important Points All-Time High (ATH) Resistance: Support and Resistance Levels: Price Action: Trade Opportunities: Bullish Scenario: Bearish Scenario: Risk Management: Final Call: Overall, the chart is showing a bullish bias, with a key decision point around the ATH. Traders should watch for either a breakout or a rejection to determine the next move.


