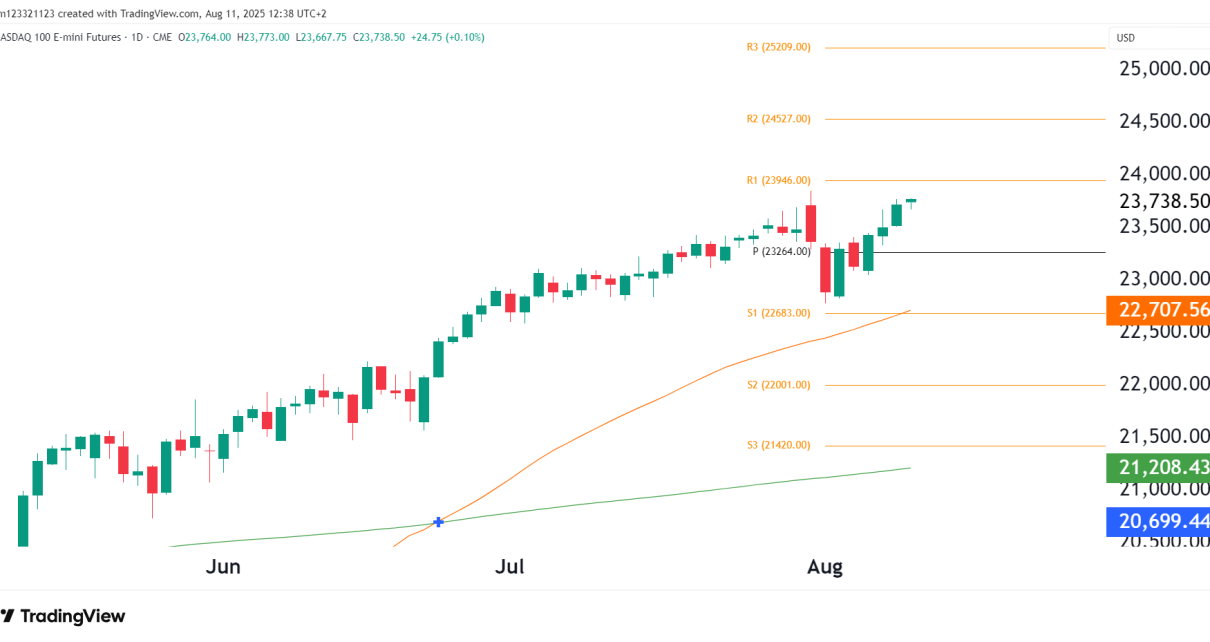
Technical Analysis Structure and Trend Any clean break above the 200-day MA opens room toward the all-time high (~43,564). A bullish “golden cross” is not yet active, but a sustained breakout could tilt momentum in that direction. Probabilities Scenario Description Probability Targets Bullish Continuation Holds trendline and breaks above 200-MA High 42,557 → 43,564 (ATH Read More…
Tag: stock market
US Equities Jump as Trump Tariff Delays Lift Mood
The US equity futures surged on Tuesday. The move was attributed to improved risk sentiment due to President Trump’s delay to implement tequihe tariffs on Eurozone imports until July 09. The decision immediately alleviated trade tension and energized investors ahead of Wall Street’s opening after Memorial Day holiday. The S&P 500 futures gained 1.2%, Dow Read More…
U.S. Dollar Index (DXY) – Technical Analysis May 27, 2025
Technical Analysis Breakdown Summary Bearish Signals Downside Targets if 98.50 breaks: Bullish Counterpoints Bias Probability Trigger/Confirmation Target/Range Bearish Continuation 65% Break and close below 98.50 97.50 → 96.90 zone Short-Term Bounce 35% Reclaim of 100.64 + RSI > 50 101.18 (50 MA), then 103.36 (R1) Key Levels to Watch Type Level Significance Resistance 100.64 Former Read More…
S&P 500 E-Mini Futures (ES) Technical Analysis – May 26 2025
Technical Analysis Bullish Developments Bullish Case (High Probability) Probability: 65% Bearish Case (Low Probability for Now) Probability: 35% Key Technical Levels Type Level Commentary Resistance 5,962.75 R1 pivot — breakout confirmation trigger ATH Target 6,170.00 Next major resistance Support 5,809.13 200-day MA – reclaimed Support 5,618.52 50-day MA Key Support 5,397.50 May swing low – Read More…
Gold Technical Analysis Long/Near Term: May 23, 2025
Overview Gold futures (COMEX: GC) continue to trade near record highs with massive long-term momentum and short-term consolidation. Price could be coiling up for another bullish breakout. With macroeconomic uncertainty, a weakening U.S. dollar, central bank demand, and inflation hedging flows underpinning sentiment, gold remains the strongest major asset class of 2025. Monthly Chart RSI Read More…
Bitcoin Hits All-Time High: Technicals (BTC Futures)
Chart Context Bitcoin has exploded through its previous all-time high. The price is now above the psychological and technical resistance at $110,150. The breakout confirms the continuation of the uptrend after a 32% pullback, which lasted four months. Technical Analysis ATH Breakout Confirmed RSI at 74.76 – Overbought, but Not Diverging Support Zones Next Price Read More…


