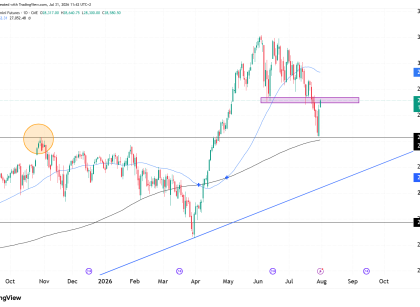
US equities bounced back as geopolitical tensions showed early signs of easing at the beginning of the week. However, underlying risks continue to cast doubt on the rally’s sustainability. Investor confidence rose after President Trump said that US-Iran talks were fruitful, which eased fears of further escalation in the Middle East. This caused oil prices Read More…
Tag: stock market
Crude Oil (CL) Technical Analysis, 23 March 2026
Introduction Crude oil has been in price-discovery mode for 4 weeks since the start of the conflict in the Middle East and appears to be finding some stability now. This is a meaningful shift. In the previous analyses, the focus was on whether crude would consolidate or retrace after the explosive move. Instead, the market Read More…
Nasdaq 100 (NQ) Technical Analysis – 20 March 2025
Introduction Nasdaq futures (NQ) are currently in a difficult position, sitting just above a key support zone near 24,500, while remaining below the 50 and 200-day moving averages. The market is mostly consolidating at this period of uncertainty surrounding the war in the Middle East. Positioning correctly is not very easy in these conditions because Read More…
Gold Futures (GC) Technicals, Bears Take Control
Introduction Gold has now clearly broken down from the symmetrical triangle that we discussed in the previous analysis. The important $5,000 level has failed, and the price is dropping fast. What was a balanced consolidation is no longer neutral. The market has chosen direction, and for now that direction is to the downside. The focus Read More…
Crude Oil (CL) Technical Analysis 18 March 2026
Introduction Crude Oil (CL) has now begun to find its feet since the start of the war in the Middle East. The picture for CL has been one of price discovery after a massive spike in the price. See our previous analysis here. After the initial surge and sharp rejection, price has begun to stabilize Read More…
Gold Futures (GC) Technical Analysis 17 March 2026
Introduction Gold futures (GC) have just broken below the symmetrical triangle on the daily chart and bulls are holding the price up with support being found at the pivot point level. In the previous analysis, the focus was on a possible expansion for the price. The lack of follow-through so far after the breakout leads Read More…


