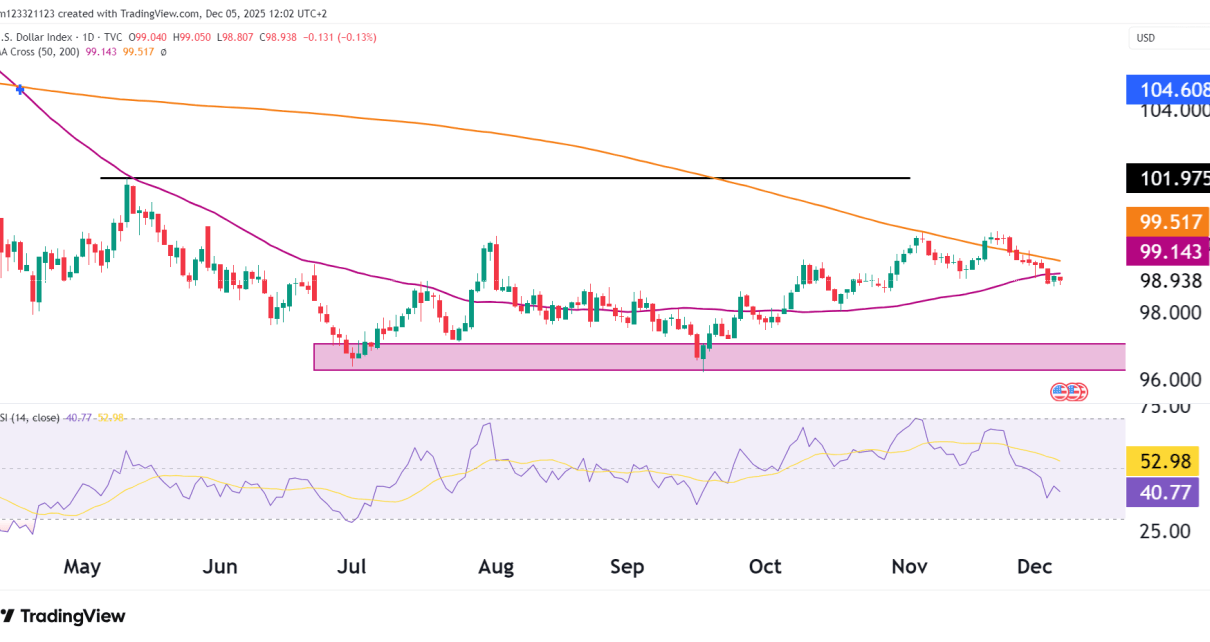
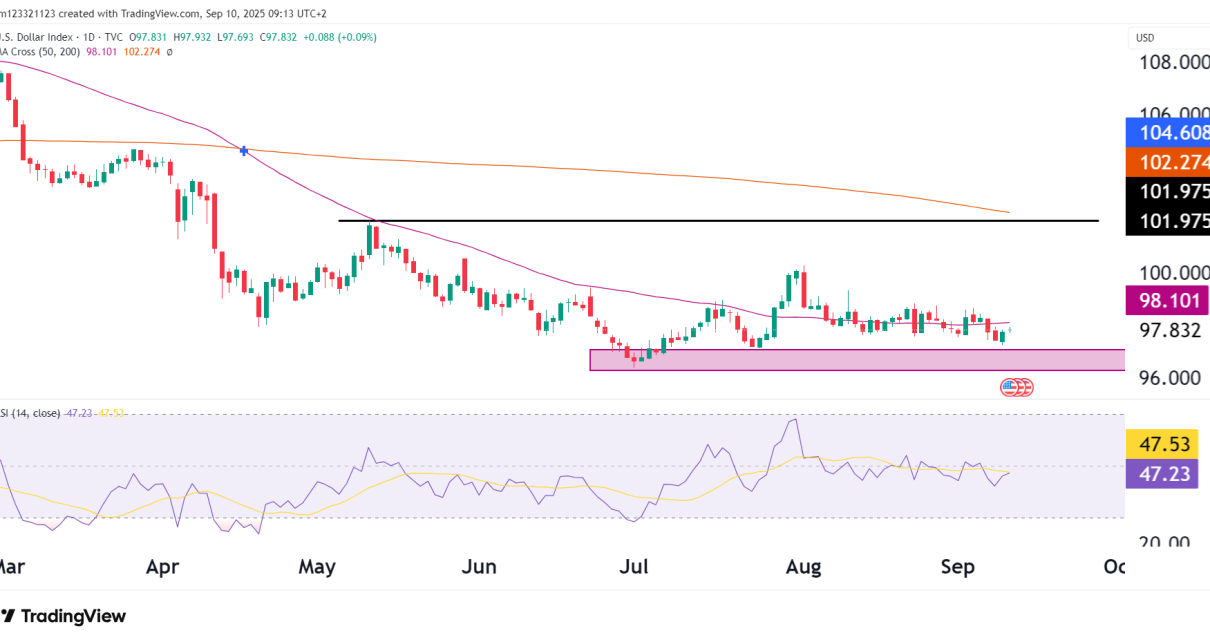
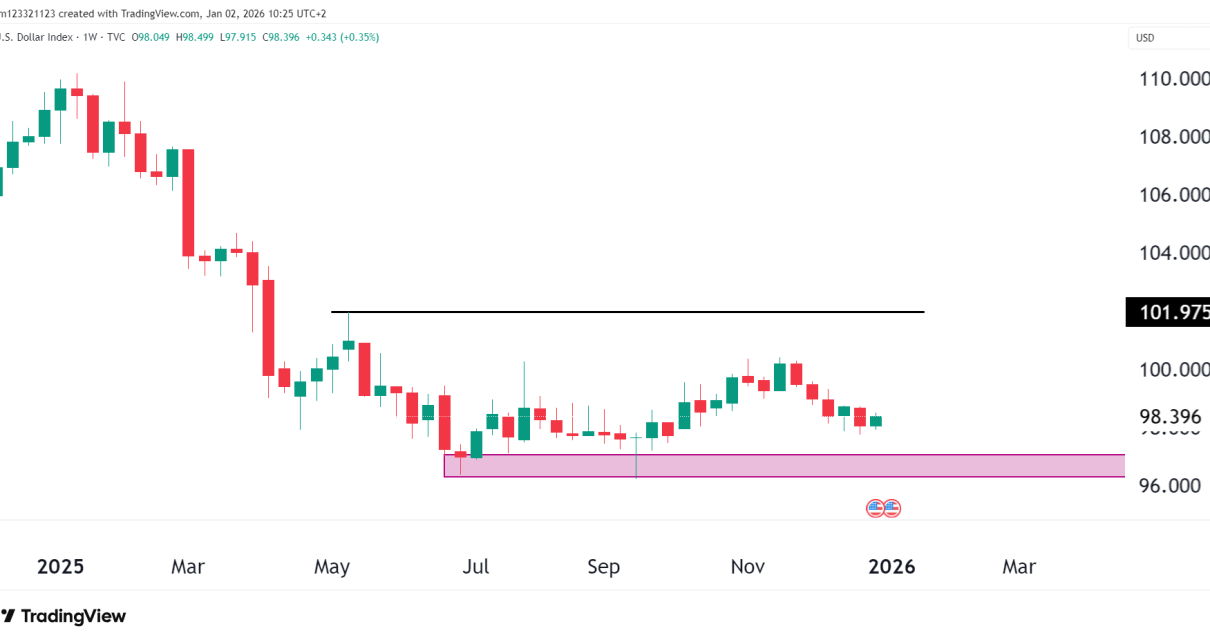
Chart OverviewThe U.S. Dollar Index (DXY) has staged a tremendous rally following Donald Trump’s presidential victory, fueled by expectations of pro-growth policies and a potential hawkish stance from the Federal Reserve. After a sharp climb of 6.89%, the dollar has reached a critical resistance zone near 106.13-108, leaving traders to wonder: is the dollar too Read More…
Tag: DXY
Is the Dollar about to Crash? Technical Outlook
Introduction The Dollar is trying to hold off from a tremendous re-balancing as the Euro begins to gain steam against the greenback. There had to be a time when, eventually, the hyper-money printing during COVID-19 would have its effect. Are we seeing that now? The Fed recently cut rates, and they signal that further rate Read More…
Does The Dollar (DXY) See Strength Returning?
Overview of the U.S. Dollar Index (DXY):The U.S. Dollar Index (DXY) is currently trading around 101.724, showing a recent bounce from a key support level. The DXY has been in a broad descending wedge pattern, which is generally considered a bullish continuation pattern. The bounce from 100.8 to 101.724 is significant, as it coincides with Read More…
Bearish momentum in DXY, short trade opportunity – watch 102 resistance
The chart provided displays the U.S. Dollar Index (DXY) on a weekly timeframe. Let’s analyze the technical indicators and identify potential bearish/short high-probability trade opportunities. Technical Analysis Descending Triangle Pattern: There is a symmetrical triangle formation. The price recently broke below the lower trendline of this triangle, signaling a potential continuation of the downtrend since Read More…
US Dollar Index (DXY) News & Technical Analysis
The decline in DXY: The DXY index has seen a recent decline, trading at around 105.125, primarily due to the strengthening of the euro and a weaker yen. The euro’s rise was driven by the results of France’s parliamentary elections, which alleviated concerns over aggressive fiscal policies and boosted European stocks and bonds (FX Empire). Read More…
Bulls hit first Dollar target, what now?
Weekly Chart Starting with the weekly chart, the Dollar has shown significant strength. Bulls have clearly taken control as indicated by the 4 weekly green closes in a row. We have successfully reached our first bullish target at 103.821, from our analysis last week. The current movement suggests that we could see further upside momentum, Read More…