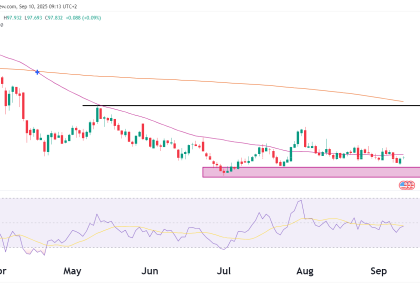
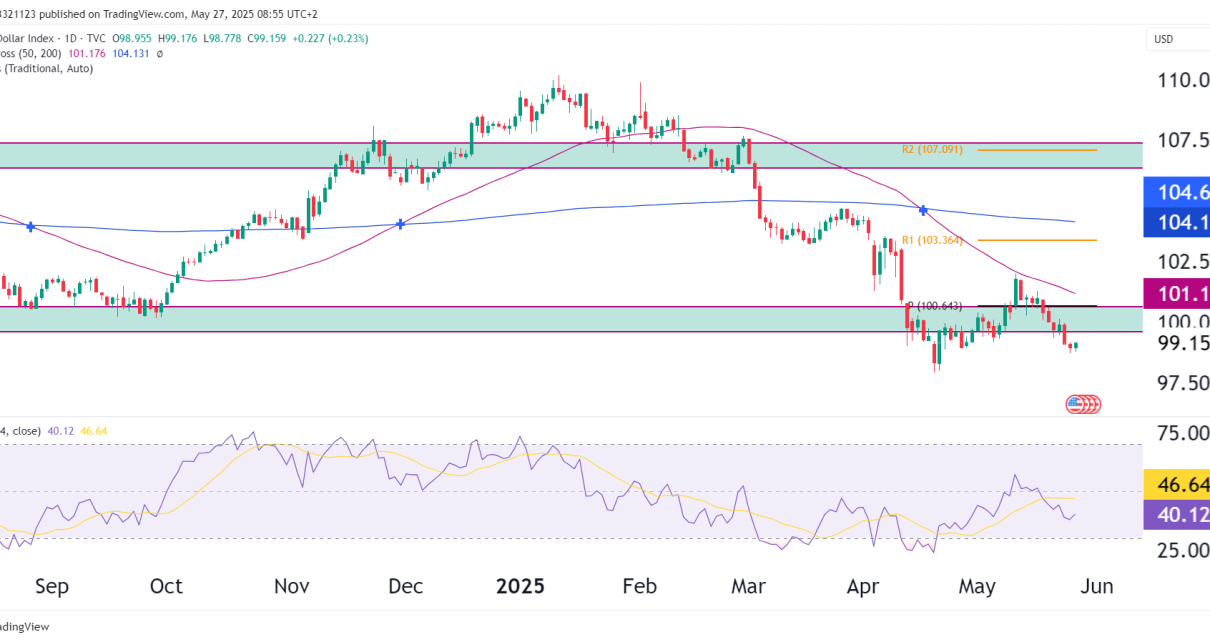
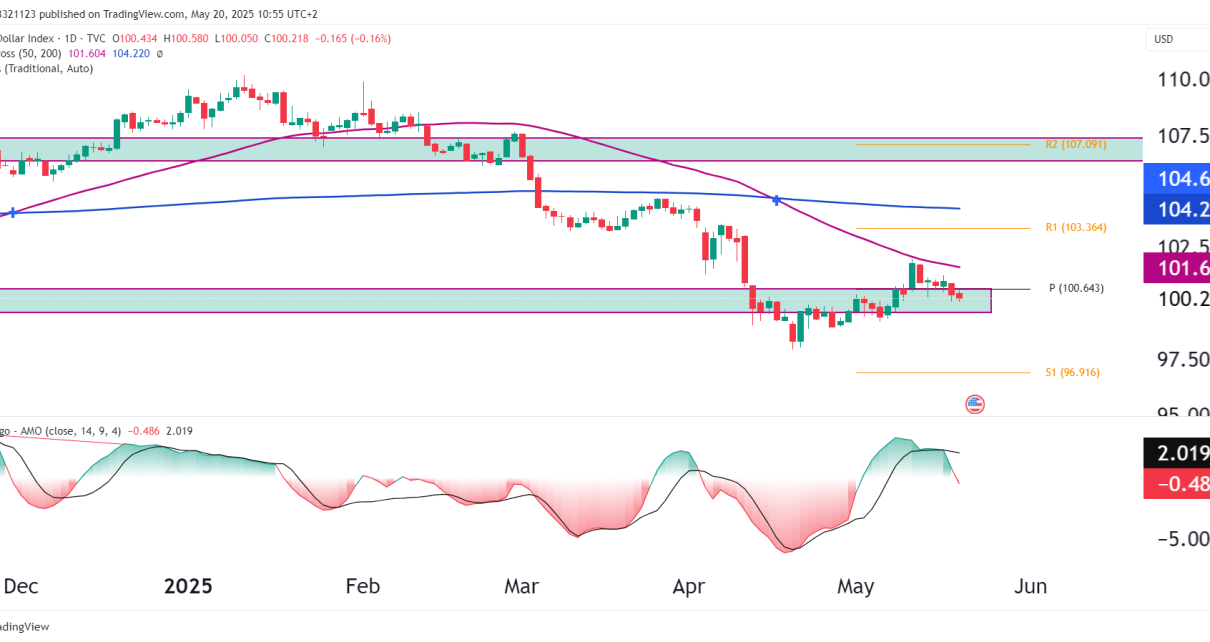
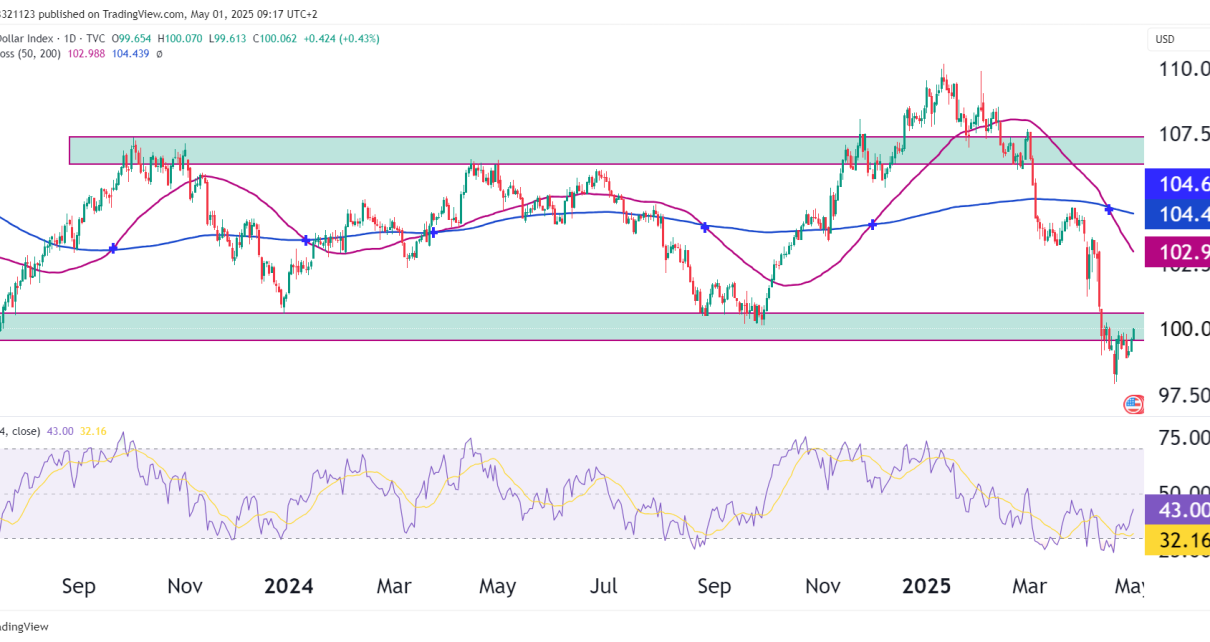
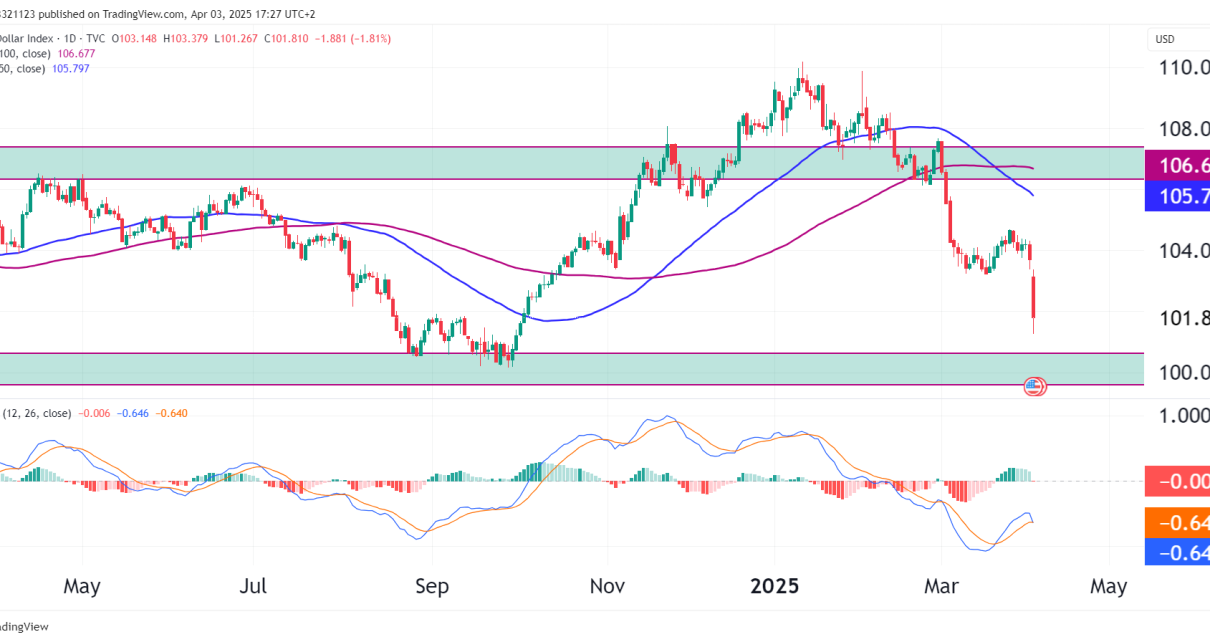
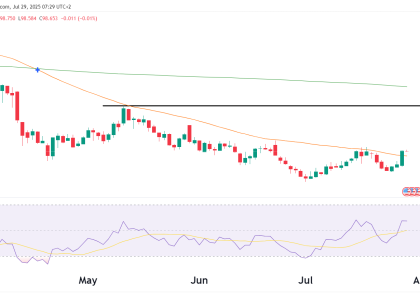
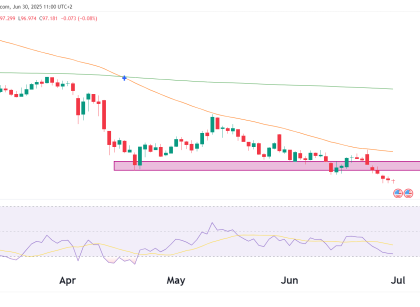
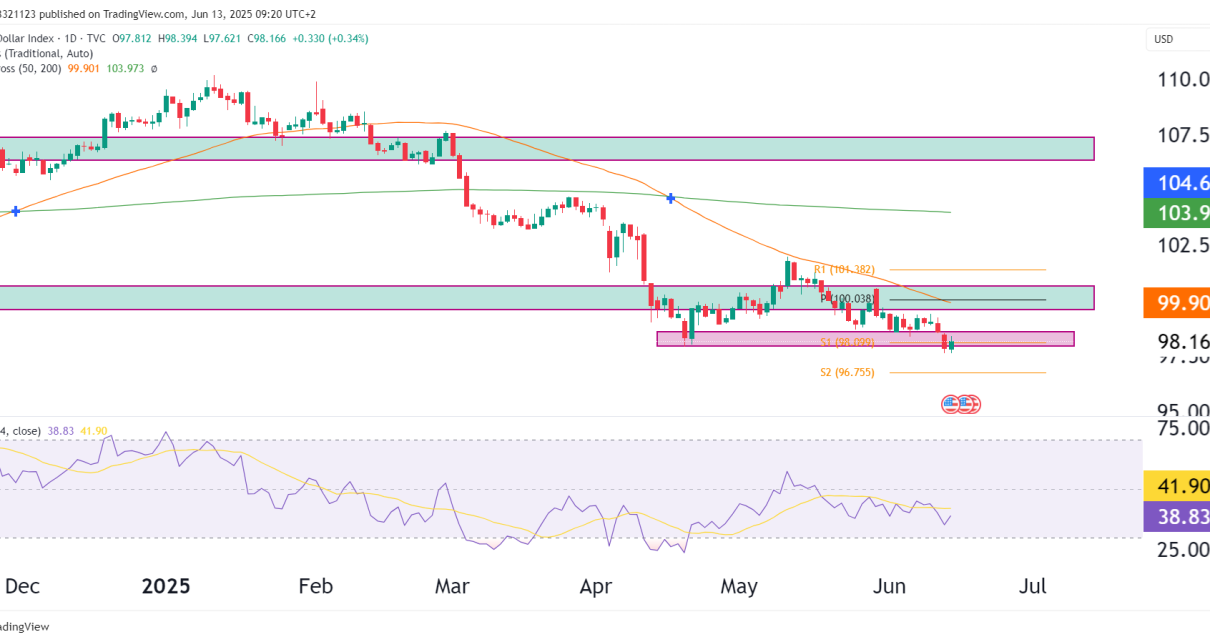
Economics Technical Analysis

U.S. Dollar Index (DXY) Holds Support—Another Rally Coming?

Introduction The U.S. Dollar Index (DXY) is currently testing a key support zone between 106-107, following a pullback. The dollar remains in a strong uptrend, trading well above the 100-week SMA (104.261). As of today 28/02/2025, DXY is trading at 107.775, up +0.69%, showing signs of stabilization after the recent pullback. If the 106-107 support Read More…

dollar weekly index technical analysis
Technical Analysis

U.S. Dollar Index (DXY) Technical Analysis – January 10 2025

Introduction The U.S. Dollar Index (DXY), which measures the dollar’s performance against a basket of major currencies, has rallied hard since the Trump victory. Lets take a closer look at the technicals. Technical Analysis Overview Weekly Chart Highlights: Technical Indicators: Fundamental Analysis The dollar’s rally is largely attributed to market optimism surrounding President Trump’s economic Read More…

dollar weekly chart DXY index. OneUp Trader funded trader program technical analysis
Technical Analysis

U.S. Dollar Index (DXY) Technical Analysis – December 30, 2024

Introduction The U.S. Dollar Index (DXY) continues its impressive rally as we conclude the year, fueled by pro-growth and pro-dollar policies under the Trump administration. The index is trading at 108.068, breaking out of a long-term consolidation pattern and aiming toward its all-time high (ATH) at 114.789. The bullish momentum has intensified, with resistance levels Read More…

Technical Analysis

Euro FX Futures (6E) Technical Analysis – December 18, 2024

Chart OverviewEuro FX Futures (6E) remain under pressure as the Dollar continues to rise. The Euro has been held at the support zone at 1.063 after the Trump victory rally of DXY. Weak momentum, confirmed by a declining RSI, raises the likelihood of further downside if bulls cannot push prices back into the prior range. Read More…

Technical Analysis

U.S. Dollar Index (DXY) Technical Analysis – December 4, 2024

Chart OverviewThe U.S. Dollar continues its bullish trajectory due to optimism surrounding Donald Trump’s presidency and expectations for a pro-growth economic agenda. The DXY has successfully broken above its long-term descending trendline, with the price now consolidating just above 106.6, a key resistance-turned-support zone. This move puts the all-time high (ATH) at 114.789 firmly in Read More…

DXY Dollar weekly chart
Technical Analysis

U.S. Dollar Index (DXY) Technical Analysis – November 19

Chart OverviewThe U.S. Dollar Index (DXY) has staged a tremendous rally following Donald Trump’s presidential victory, fueled by expectations of pro-growth policies and a potential hawkish stance from the Federal Reserve. After a sharp climb of 6.89%, the dollar has reached a critical resistance zone near 106.13-108, leaving traders to wonder: is the dollar too Read More…