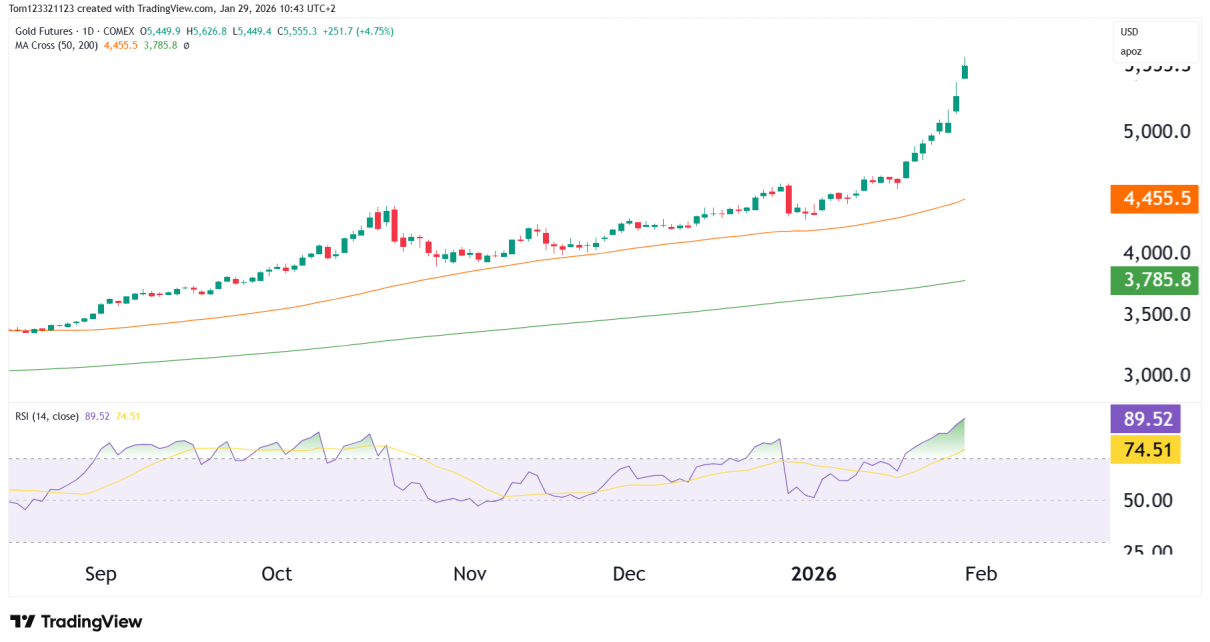
Key Technical Developments Since Last Analysis: Technical Analysis Chart Structure: The triangle pattern has now confirmed a clean breakout, validated by a bullish expansion in range and follow-through. However, the past 2–3 daily candles are showing small-bodied indecision, implying consolidation just below the key $3,509 resistance level. Moving Averages: Resistance & Target Levels: Momentum Outlook: Read More…
Technical Analysis
Nasdaq (NQ) Technical Analysis 17 June 2025
Technical Breakdown Resistance Zone (22,264 – 22,425): MACD: Moving Averages: Outlook & Trade Setup: Term Bias Notes Short-Term (1–2 weeks) Cautious Bullish Price nearing ATH, but momentum is fading. Risk of rejection. Medium-Term (June–July) Bullish Breakout above ATH could trigger a run to 23,151 (R2) or 24,444 (R3). Long-Term Structural Uptrend Macro trend remains bullish Read More…
Crude Oil Surges on Geopolitical Shock, Technical Analysis
Current Price: $73.51Change: +0.73%Move from June low: ~$60.09 → ~+22% rally Key Technicals: Crude has triggered a high-momentum breakout from a zone where CL was consolidating for a long time. This wasn’t a grind higher, though; this was a news-driven surge with a technical structure now favoring trend continuation, but with risk of overextension. Middle Read More…
Dollar Technical Analysis – What’s Driving the Decline?
Price Action & Momentum Technically, DXY is in a confirmed bear trend. A sustained close below 97.93 would expose the 96.75 level next (S2). Reclaiming 100 would be necessary for bulls to regain control. Macroeconomic Pressures on the U.S. Dollar Rate Cut Expectations Soften Yield Appeal Twin Deficits – Fiscal and Current Account Political Uncertainty Read More…
Nasdaq Futures Technical Analysis 11 June 2025
Technical Overview Resistance Zone & ATH Key Pivot Levels Pivot Zone Price ATH / R1 22,425.75 R2 23,151.50 R3 24,444.00 Pivot (neutral) 20,971.50 S1 (support) 20,084.00 It looks like its just a matter of time before the price breaks above the high but nothing is certain in markets so we have to wait and see. Read More…
Gold Technical Analysis: Triangle Breakout, Eyes on $3,620
Chart Structure Symmetrical Triangle Previous Demand Zone Indicators RSI (14) Pivot Levels Level Description S1 $3,143 Key support/demand base Pivot $3,246 Inside triangle, base for breakout R1 $3,468 Initial resistance on breakout R2 $3,620 Primary measured target R3 $3,792 Stretch target if breakout is impulsive Market Context Trades Bullish Breakout Entry Failure Reversal Watch Bear/Bull Read More…