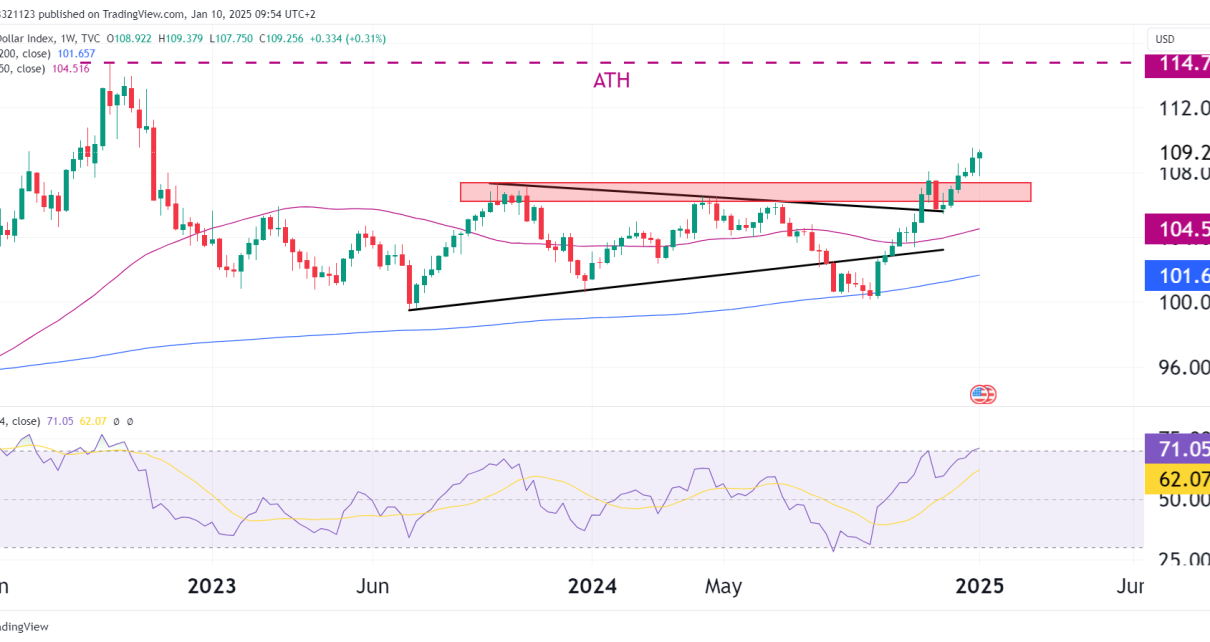
6E euro FX futures daily cahrt technical analysis
Technical Analysis

Euro FX Futures Technical Analysis

Chart Overview In this analysis, we’ll take a closer look at the daily chart of the Euro FX Futures, focusing on the price movements as 6E has been stuck in a range for over one year. This range is between well-defined support and resistance zones, with the resistance zone at 1.10265, and the support zone Read More…

Technical Analysis

S&P 500 Futures (ES) Technical Analysis: Bulls Are Back

S&P 500 Chart Overview In this analysis, we’ll dive into the daily candlestick chart of the S&P 500 E-mini Futures, focusing on the technicals and chart patterns as ES bulls make a return. ES is up 5% since its low from April and the selling pressure appears to be weaking more and more. Price Action Read More…

Technical Analysis

Crude Oil Futures (CL) Shift From Bullish to Bearish

Overview In this analysis, we’ll take a closer look at the CL futures chart, which displays daily price action along with several technical indicators, including a Simple Moving Average (SMA), Pivot Points (traditional, automatic setting), and the Relative Strength Index (RSI). CL Technical Analysis Trend and Price Action Prices were in an uptrend from February Read More…

futures trading strategies for beginners
Technical Analysis

Bitcoin Technical Analysis: Descending Channel and Key Support Levels

Introduction Based on our analysis this week, we can see that Bitcoin is currently in a short-term bearish trend after a big pump at the start of the year. There is a descending channel pattern starting from late March. This pattern is characterized by consistent lower highs and lower lows within the channel. Support and Read More…

Technical Analysis

Gold Futures Top Trades: Technical Analysis

Chart Overview Trendlines and Channel (BULLISH):The chart shows a rising channel pattern. The price is bouncing between the top and bottom lines of the channel, and these lines are clear and strong. Candlestick Analysis (BEARISH):The recent candlesticks are a mix of green and red, and the latest one is a big red candle. This is Read More…

Technical Analysis

NASDAQ (NQ) Key Technical Analysis Trades

NASDAQ Chart Overview In this chart, we’re looking at the NASDAQ 100 E-mini Futures (10-minute intervals) along with the Simple Moving Average (SMA), Relative Strength Index (RSI), and Volume Profile Visible Range (VPVR) indicators. Price Action and Technical Patterns Channel and Breakout Analysis We can see that the price was trading within an ascending channel, Read More…