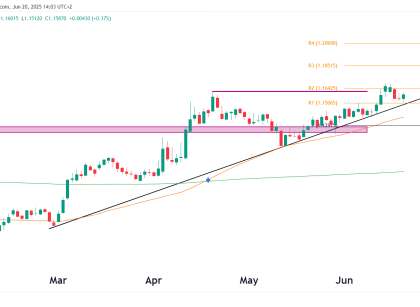
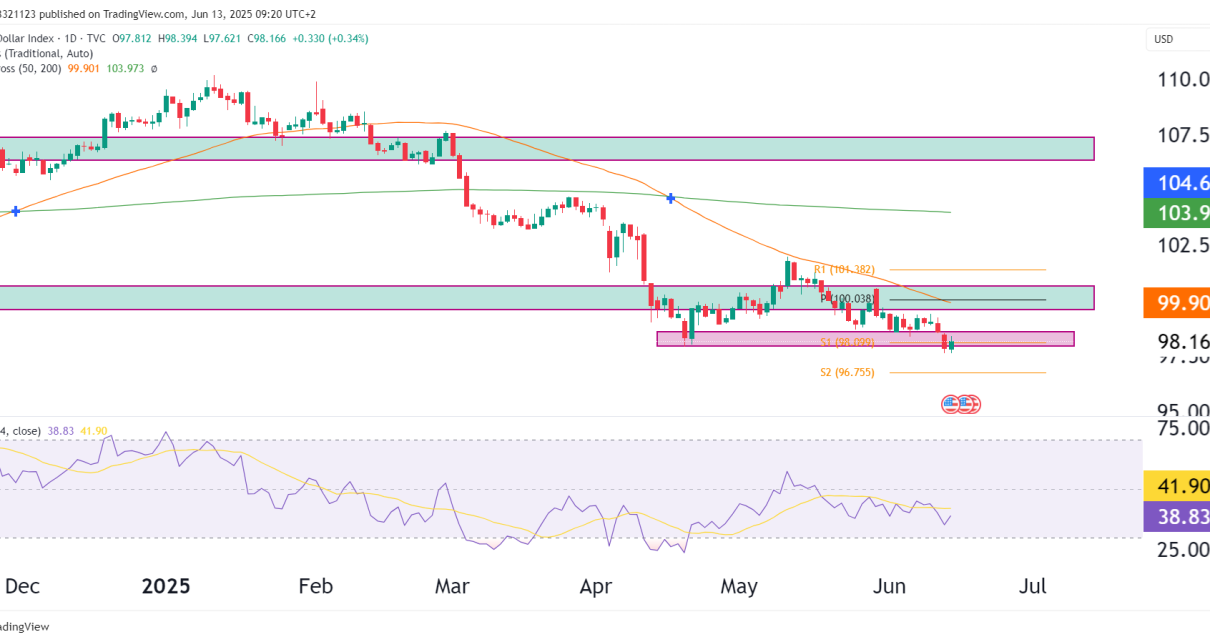
Chart OverviewThe Nasdaq 100 E-mini Futures are showing signs of exhaustion at current levels, as the price action is forming a rising wedge pattern—a bearish signal when it appears at the top of a rally. With the price sitting near 21,800, the market appears stretched. Let’s break down what this could mean for traders and Read More…
Technical Analysis
Gold Futures (GC) Technical Analysis – December 11, 2024
Building on the November 25 analysis, where we saw a potential Head and Shoulders (H&S) forming, the updated chart tells a different story. The $2,542.3 “Last Support” held firm, and price action has invalidated the H&S pattern, leading to a false alarm on the formation. The bullish momentum has pushed prices back toward $2,707.6, so Read More…
S&P 500 E-mini Futures (ES) Technical Analysis – December 9, 2024
Chart OverviewSeven days since the last analysis, the S&P 500 E-mini Futures remain firmly bullish. The price is steadily advancing toward the 6,250 target due to the influence of positive sentiment surrounding Trump’s presidency and his pro-growth policies. Let’s evaluate the updated price action and provide insights into what might unfold next. Key Developments Over Read More…
Crude Oil Futures Technical Analysis – December 5, 2024
Chart OverviewCrude Oil prices are still sitting in the yearly support zone around $67-$69. The market is watching closely for a breakout above $75.30, which aligns with the descending trendline resistance. Adding bullish momentum is the recent news of U.S. crude oil stockpiles falling more than expected, sparking hopes for tighter supply and higher prices. Read More…
U.S. Dollar Index (DXY) Technical Analysis – December 4, 2024
Chart OverviewThe U.S. Dollar continues its bullish trajectory due to optimism surrounding Donald Trump’s presidency and expectations for a pro-growth economic agenda. The DXY has successfully broken above its long-term descending trendline, with the price now consolidating just above 106.6, a key resistance-turned-support zone. This move puts the all-time high (ATH) at 114.789 firmly in Read More…
S&P 500 Futures ($ES) Technical Analysis – December 2, 2024
Chart OverviewBuilding on the November 13 analysis, the S&P 500 E-mini Futures (ES) continues its bullish trajectory, maintaining strength post-Trump’s presidential victory. The updated chart shows the rally firmly intact, with the target at 6,250 drawing closer. Let’s analyze what’s next for price action based on current conditions and future prospects. Key Developments Since November Read More…


