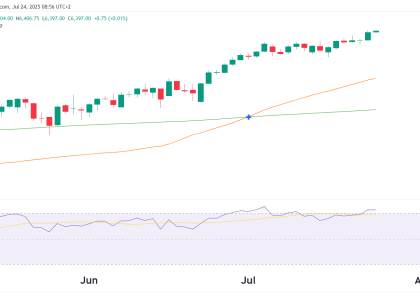
📈 Current Market Structure and Key Levels The E-mini Dow Jones (YM) futures recently reached an All-Time High near the 44,000 mark before facing a mild correction of 4%. This pullback phase has brought prices back toward some key zones that might offer high-probability entry points for bullish trades. Let’s break down these zones and Read More…
Technical Analysis
Russell 2000 (RTY Futures) Technical Analysis 31/10/2024
Introduction The daily chart of the RTY (Russell 2000) futures is currently in an uptrend that is not exactly strong but is an uptrend nonetheless. Let’s break down the chart’s technical analysis and the current market sentiment as we approach the US elections on November 5th. Technical Analysis The Russell 2000 index maintains its position Read More…
Euro futures (6E) bullish reversal on the cards?
Introduction This daily chart of the 6E futures (Euro Futures) shows a few key technical levels and patterns amid some macroeconomic uncertainties. Currently, there is considerable tension surrounding the Euro’s strength, driven by the ongoing immigration crisis in Europe and the approaching U.S. election, which may strengthen the U.S. dollar due to shifts in U.S. Read More…
Crude Oil Bloody Monday, Technical Analysis 29/10/2024
CL futures suffer worst day in two years Crude oil markets experienced their steepest single-day decline in nearly two years on Monday, with WTI crude plunging over 6% to settle at $67.38 per barrel. The sharp selloff came as traders unwound risk premiums built up in anticipation of potential disruptions to Iranian oil facilities, which Read More…
Bitcoin 8% Away From New All-Time-High!
Bitcoin Bulls Buy Back Bitcoin has maintained its position as the leading cryptocurrency in 2024, building on the momentum generated by the historic approval of spot Bitcoin ETFs in January. The digital asset, which started the year trading around $45,000, has rallied 58% since January. Wall Street’s traditional finance giants, including BlackRock and Fidelity, have Read More…
Nasdaq Futures (NQ) Technical Analysis
Introduction Its been exactly 400 days since the the 50 simply moving average crossed back above the 200 simple moving average in a 100% rally from bottom to the top in NQ. The index has rallied hard and technicals are still pointing to higher prices as the bulls over power the bears. Technical analysis though Read More…