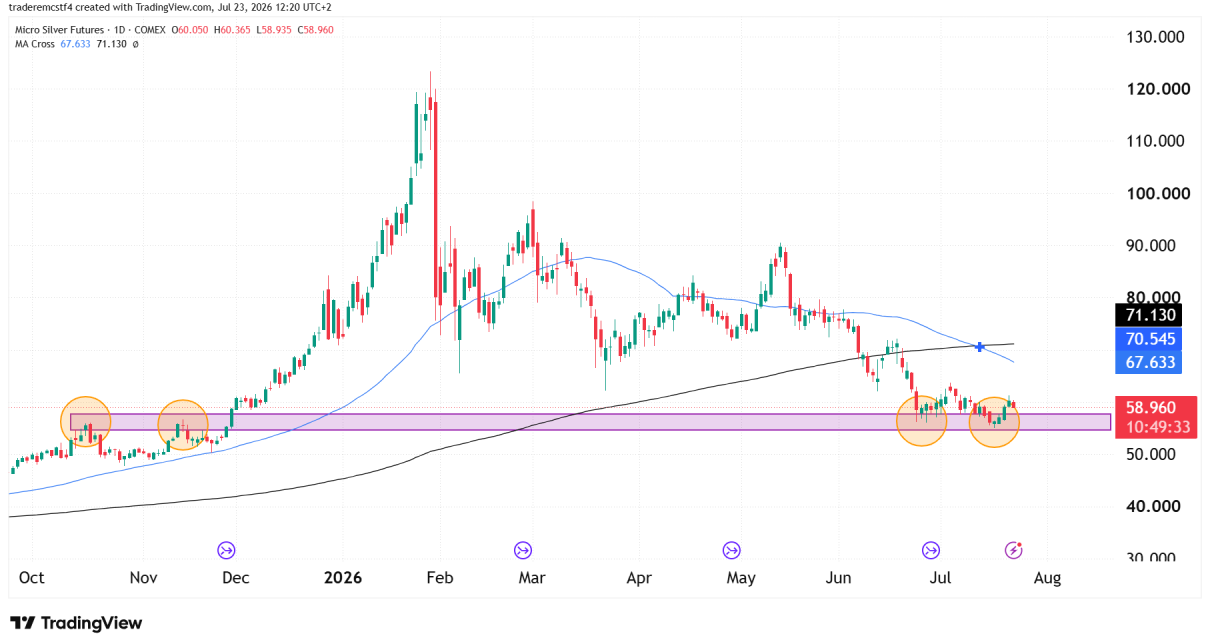
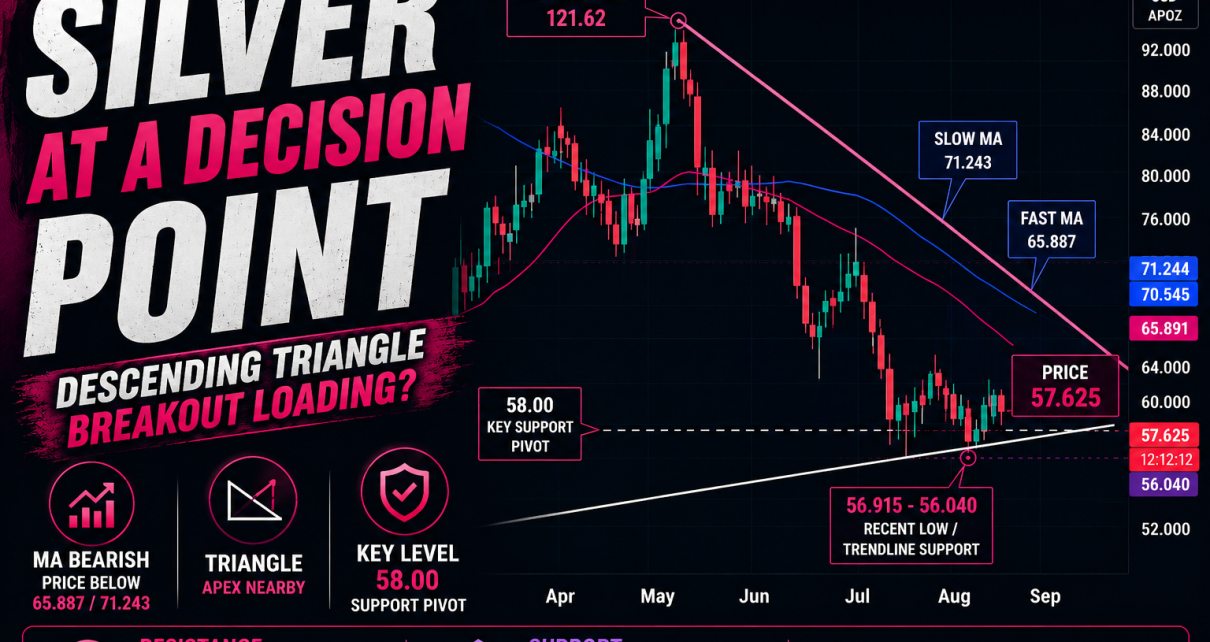
dow jones technical analysis
Technical Analysis

Dow Jones Futures (YM) Technicals Mixed

Recap Current Status:Price has stabilized above $40,000, staging a grind higher — yet no breakout has occurred. Price Overview – April 29, 2025 Technical Picture Price Action: Pivot Levels: Support & Resistance Level Role S2 38,948 Confirmed support S1 40,604 Local resistance → now testing Pivot 42,362 Key inflection zone R1 44,018 First bullish breakout Read More…

futures trading strategies for beginners
Technical Analysis

Bitcoin Correction Is Over – New Highs In Sight?

Previous Analysis Recap (April 22nd) In our last review, we discussed: The key takeaway then was that BTC was setting up for upside provided it could hold above $87,000. As of today, BTC has confirmed that move, clearing resistance, retesting, and pushing higher. Price Update – April 28, 2025 Technical Analysis – Fresh Insights Structure: Read More…

gold technical analysis
Technical Analysis

Can Gold Futures (GC) Bullish Run Keep Going?

Context: 2025’s Market Chaos Is Gold’s Fuel Gold’s explosive rally has been fueled by macro turmoil: Gold has outperformed equities, bonds, the dollar, and even oil. That alone demands attention. Technical Analysis – Daily Chart Breakdown Trend Structure: Bullish and Intact Flag Formation or Consolidation at Highs? RSI and Momentum Indicators 🟢 Bullish Case Potential Read More…

Nasdaq 100 index futures (NQ)
Technical Analysis

NASDAQ Futures (NQ) Dead Cat Bounce?

Current Market Snapshot: Chart Technicals Double Bottom Formation Emerging Downtrend Break Under Scrutiny Moving Averages 🐂 Bullish Scenario If NQ can break and close above the descending trendline and 19,000, we have a confirmed breakout of the short-term downtrend channel. Targets on the upside: This setup would turn the recent price action from a bounce Read More…

futures trading strategies for beginners
Technical Analysis

Bitcoin Futures (BTC) Technical Analysis – April 22, 2025

Technical Analysis Bitcoin has spent the past several weeks grinding out a bottom, forming a rounded base pattern just above the critical 78,000–80,000 support. This basing action has been healthy — no panic selling, rising volume, and a higher low structure formed. BTC is breaking above the key 87,000 level and testing the upper edge Read More…

6E euro dollar after donald trump victory
Technical Analysis

Euro Continues to Surge on Weakening USD

Weekly Chart Daily Chart Technical Key Points Indicator/Zone Status Reflection Weekly Fib 61.8% Cleared Major bullish technical trigger Weekly MACD Bullish cross Strong momentum confirmation Daily SMAs Bullish trend Golden Cross formation Daily RSI Overbought but stable Caution for minor pullbacks, not trend reversal Pivot Structure Breaking R2 toward R3 Signs of powerful trend continuation Read More…