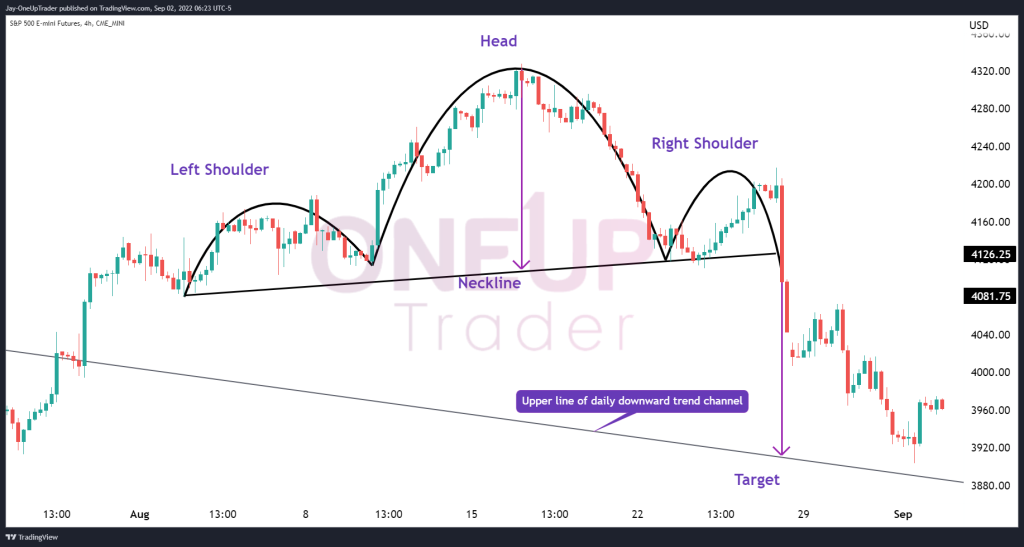
- H&S target met on the 4-Hour Chart
- Prices retesting the downward channel on the daily Chart
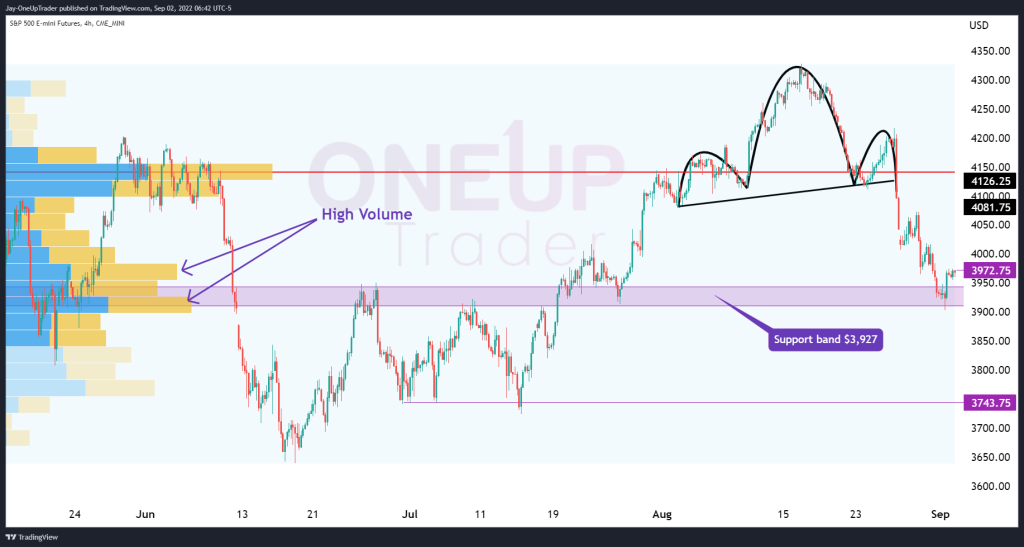
- Support Level and high volume zone on volume profile
In reference to our technical analysis back on August 18th, ES was trading at $4,260 and we saw a high probability of a break through the upper trend channel. This happened on July 28th with a convincing 3% up move that day.
Fast forward to today’s price action, there was a head and shoulders pattern that formed on the 4-hourly Fast forward to today’s price action, a Head and Shoulders (H&S) pattern formed on the 4-hourly chart that has now hit its target. To determine a target when trading the H&S pattern, we simply measure the Head to the neckline, as shown with the purple arrow, then paste that at the break of the neckline. Interestingly this gave a clear target to the upper line of the downward trend channel as reported on August 18th.
Support Level and volume profile
Still, on the 4-Hourly time frame, there is a significant support band at $3,927. That level has been tested multiple times, and there is a volume spike on the volume profile indicator. This suggests that a lot of the trading in the past three months has been around the $3,927 level.
We expect a significant amount of bids around this level once the price gets there. Also, looking for a reversal pattern on a shorter time frame, such as a 1-2-3 reversal or a candlestick pattern that could signal a short-term move to the upside, may be worthwhile. The only way to get a confirmation for this, however, is to wait for the price to retrace into the support band and see how it plays out.
If we get a break to the bottom of the band, targets will be at $3,743.75, but a wider stop would be required to give the trade as much room as possible.
If we get a bounce off the support band and a reversal on a shorter time frame, it’s a high-risk reward ratio trade because we can define our risk as below the band while the market continues its bullish momentum. Targets for the long trade would be $3,972.75 in the short run.