


Introduction
Gold Futures (GC) have extended their breakout, pushing decisively above the $5,000 level and further into price discovery. What began as a clean move above prior all-time highs has now turned into a powerful bullish trend, with buyers showing little hesitation even as momentum surges.
Gold has been a top performer in the past months, up 84% going back 1 year.
Thesis Summary (At a Glance)
Primary trend: Strongly bullish
Current move: Price discovery / momentum expansion
Line in the sand: $4,780–4,800
Bias-defining level: $5,000 acceptance
Risk to thesis: Loss of former ATH support and momentum regime shift
Why This Matters Right Now
Gold rising while stocks move sideways is an important signal.
In the past, when gold gets stronger and stock volatility stays low, it usually means investors are shifting their portfolios, not panicking. They’re not abandoning risk altogether. Instead, they’re spreading their exposure as uncertainty grows around interest rates, currencies, and long-term buying power.
Market Structure & Trend
Daily chart
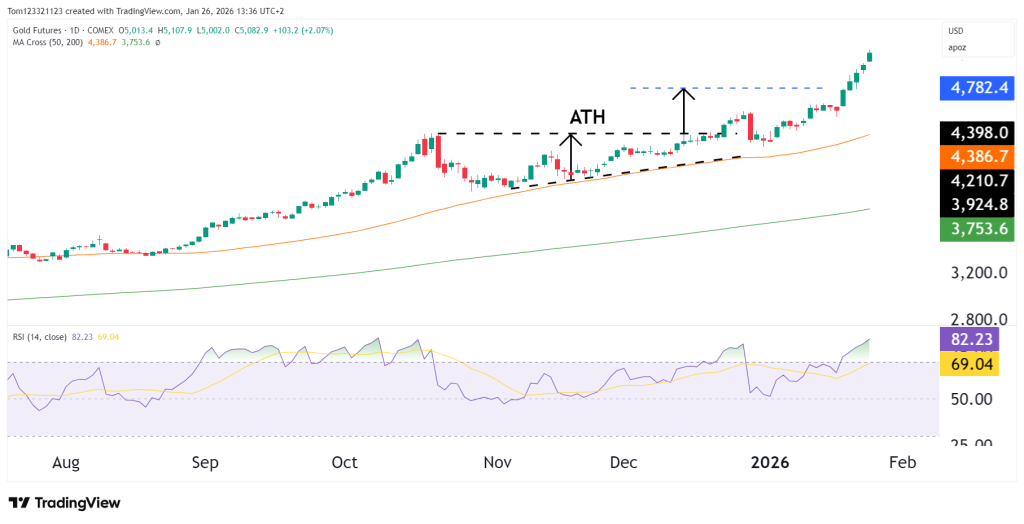
The daily chart shows a clean trend continuing higher. After moving back above the old all-time high around $4,390–4,400 and staying there, gold paused briefly and then pushed higher again. That pause turned into another move up, showing strength, not exhaustion.
Price is still holding above the rising 50-day moving average, which has consistently acted as support during the rally. Pullbacks have been small, there’s been no heavy selling, and buyers have stepped in quickly on every dip.
Gold is now in price discovery, meaning there are no clear technical resistance levels left. Any resistance from here is more about investor psychology than chart levels.
Key Technical Levels
Line in the Sand
- $4,780–4,800: Loss of this zone would signal failed price move and materially weaken the bullish thesis.
Bias-Defining Levels
- $5,000: Sustained trade above this level confirms ongoing price discovery.
- $4,390–4,400: Former ATH and major structural support.
Extension / Reference Levels
- $5,200–5,300: Near-term upside extension based on momentum continuation.
- $5,500: Psychological stretch target if trend acceleration persists.
Volatility & Trend Health
Despite the magnitude of the move, volatility remains controlled. There are no signs of blow-off behavior, such as large upper wicks, impulsive reversals, or panic volume.
This supports the view that gold is advancing through measured institutional accumulation, not speculative excess.
Cross-Asset Context
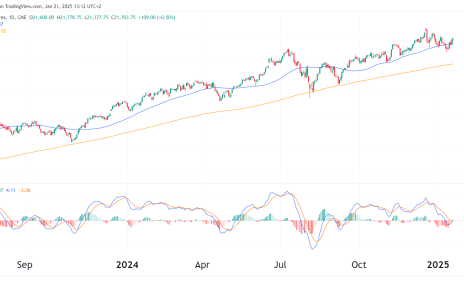
- Equities (ES / NQ): Consolidating near ATHs, not confirming gold’s momentum but not opposing it either.
- U.S. Dollar (DXY): Range-bound, removing a major headwind for gold.
- Real yields: Struggling to rise meaningfully, historically supportive of gold.
- Crude oil: Stabilizing, suggesting macro slowdown rather than collapse.
Looking Forward: Scenarios
Bullish Continuation (50%)
Gold holds above $5,000 and extends toward $5,200–5,300 as momentum remains bid.
Sideways Consolidation (30%)
Price ranges above $4,800, allowing momentum to reset without damaging structure.
Corrective Pullback (20%)
Failure to hold $4,780 opens a retracement toward $4,400, still constructive within the broader trend.
Bottom Line
Gold is breaking out again, continuing with its strong bullish behaviour. Acceptance above $5,000 confirms a new phase of price discovery, supported by strong structure, controlled volatility, and favorable macro alignment. While short-term consolidation is always possible after sharp advances, the path of least resistance remains higher unless proven otherwise.
This analysis is for educational and informational purposes only and does not constitute trading advice or a recommendation to buy or sell any futures contracts. Futures trading involves significant risk and may not be suitable for all investors. Always conduct your own research and consult with a licensed financial professional before making trading decisions.

