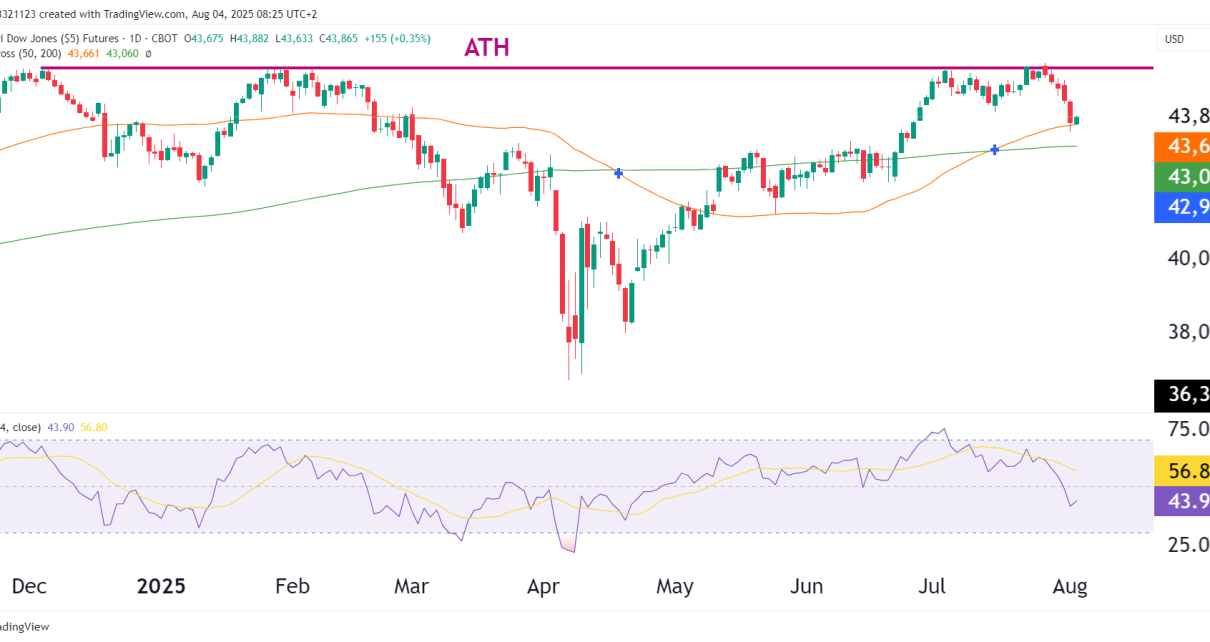
Chart Overview – Daily Timeframe (YM) Current Price: 43,865Change: +155 (+0.35%)50-day MA: 43,661200-day MA: 43,060RSI (14): 43.90 — declining momentumATH (All-Time High): ~45,280 (not reclaimed) Technical Analysis Structure & Momentum: Risk Zones: Market Context Relative to Other US Indices: Macros in Play: Probability Table Scenario Estimated Probability Commentary Reclaim ATH and push above 45,300 20% Read More…
Month: August 2025
Interest Futures Slip as Treasury Yields Surge on Higher Tariffs
Interest futures eased on Friday as US Treasury yields soared at the deadline of Trump’s tariffs. The US president imposed high tariffs on several of the country’s major partners, including Canada and South Korea. However, trading remained thin as market participants eagerly awaited the US monthly employment report. On Friday, Trump’s tariff deadline was hit, Read More…
Gold (GC) Technical Analysis, 1 August 2025
Current Price: 3,342.30Change: -6.30 (-0.19%)ATH: ~3,51050-day MA: 3,355.4200-day MA: 3,008.8RSI (14): 48.45 (Neutral to Weakening) Gold Trend This Year Technical Analysis Technical Context Indicator / Feature Current Reading Implication Price vs ATH ~170 pts below ATH Consolidation under key resistance 50-day MA Price sitting on it Neutral support test Trendline (YTD) Still holding Break would Read More…