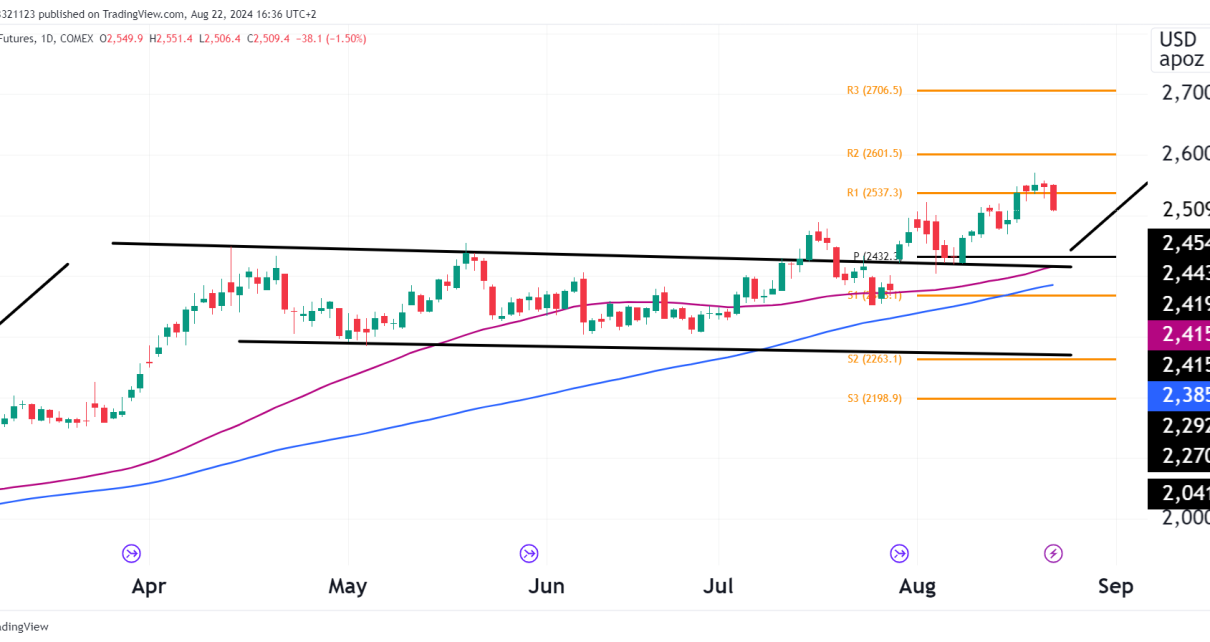
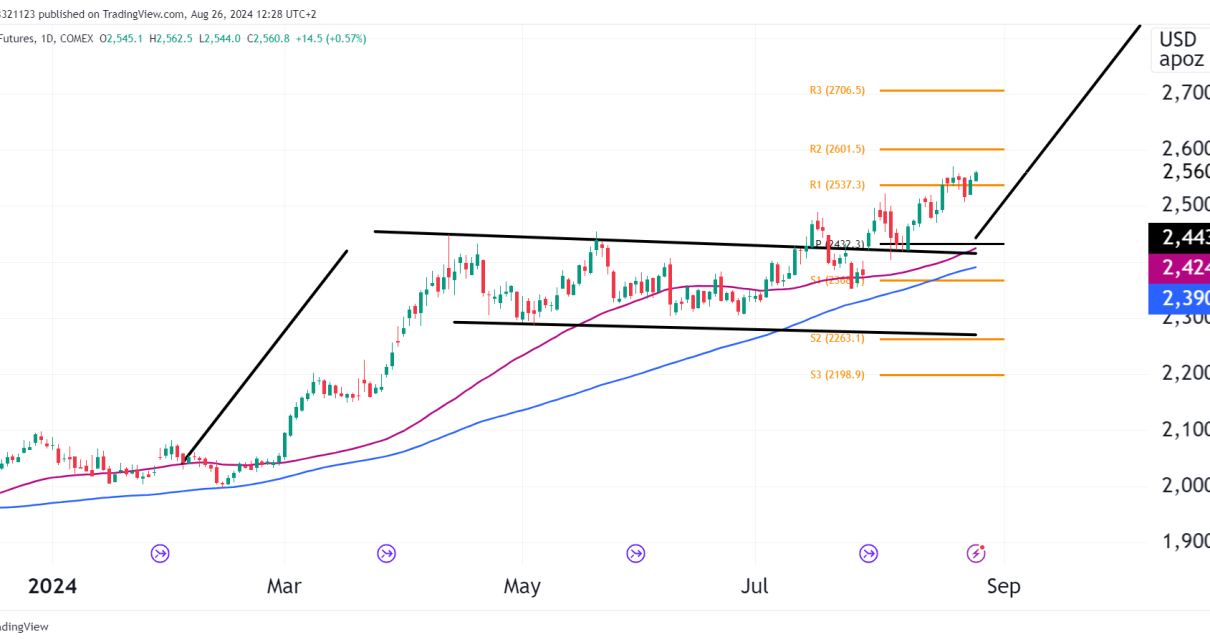
On Tuesday, equities ended lower as there was a slight increase in Treasury yields. Moreover, investors were speculating on the timing and magnitude of Fed rate cuts in 2024 and anticipating inflation data later in the week. The likelihood of a rate cut in March has decreased from 79% to 65.7%, according to CME’s FedWatch Read More…
Tag: stock market
E-mini Dow Jones Futures Technical Analysis
Taking a top-down approach, the weekly time frame shows price exhibiting strong bullish momentum as it rapidly approaches the new all-time highs around 37822 after the previous was broken. The weekly RSI reads 58.82, reflecting neither overbought nor oversold conditions yet and indicating additional room likely remains for this uptrend to continue before exhaustion risk Read More…
Equities Rally Amidst Treasury Yield Decline
On Monday, equities gained as a drop in Treasury yields lifted mega-cap stocks. Treasury yields fell ahead of inflation readings and new government debt supply, with the 10-year US Treasury yield hitting a session low of 3.966%. The Nasdaq and S&P 500 saw their first daily percentage climbs of over 1% since Dec. 21. These Read More…
Gold Futures (GC) multi-timeframe analysis
The weekly chart shows a triple-top reversal pattern forming, with resistance around $2088. This is a pivotal zone – if price can break out above $2088 decisively, it would invalidate the bearish pattern and imply an upside breakout. However, failure to break resistance could confirm the pattern and precede a downward move. The weekly RSI Read More…
S&P 500 futures (ES) mixed signals, potential profits
Starting with the weekly chart, the Relative Strength Index (RSI) is hovering around 63.11, which is above the midline but below the overbought threshold of 70. This suggests that while the market has bullish momentum, it is not yet in extreme territory where we might expect a pullback. The RSI-based Moving Average (MA) is slightly Read More…
EURO FX futures (6E) bulls & bears fight it out
Weekly Chart Analysis:The weekly chart shows the price fluctuating within the Gaussian channel. The recent trend is sideways, with the price fluctuating between the upper and lower bands of the channel. The ‘Higher High’ (H) and ‘Lower Low’ (L) indicate a lack of a clear long-term trend. The RSI is at 54.37, which is neutral, Read More…