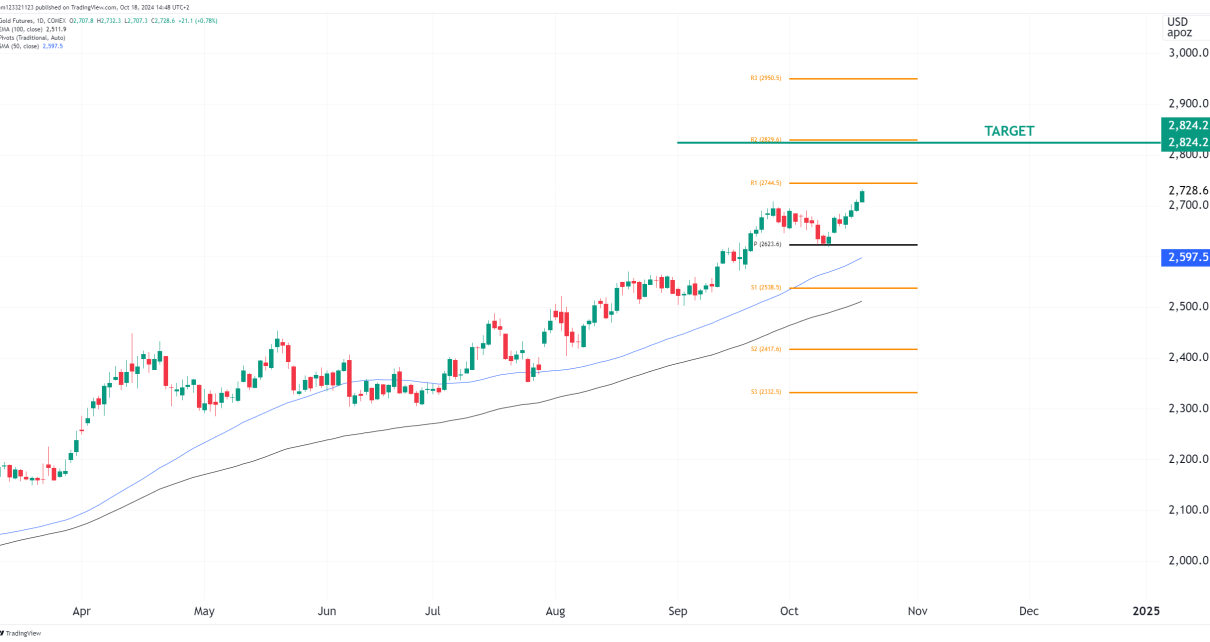
Weekly Chart On the weekly chart, bond buying is evident as the yields have continued to decrease since 2020. The RSI has moved above the neutral zone and is sitting at 53.19. The weekly does not give much clues about where we could see it moving in the near term and is neutral. Daily Chart Read More…
Tag: gold futures (GC)
Scalp Trading vs Day Trading Strategies
Introduction to Scalp Trading and Day Trading Scalp trading and day trading are two prominent trading strategies with very distinct approaches. Scalp trading involves making many trades in a single day to capture small price movements. It requires close market monitoring and high precision. Day trading refers to buying and selling financial instruments within the Read More…
Euro Bears Start Taking Control (6E): Technical Outlook
Weekly Chart Analysis for EURO FX Futures:The weekly chart shows price oscillating between a tight range of support and resistance. The Moving Average Convergence Divergence (MACD) is flat and close to the zero line, indicating a lack of strong momentum in either direction. The support zone around 1.05900 is critical, and a break below would Read More…
NASDAQ Futures (NQ) firmly bullish
Weekly Chart Analysis for NASDAQ 100 E-mini Futures:The weekly chart shows price in a clear ascending channel pattern, with NQ positioned in the upper half of the channel. The Relative Strength Index (RSI) is sitting in overbought territory, however. The all-time high (ATH) stands as the ultimate resistance level, which price has closed above in Read More…
Gold Prices Edge Up Ahead of Key US Economic Reports
On Tuesday, gold prices rose slightly as investors awaited a series of US economic data releases this week. The data is expected to provide insights into the Federal Reserve’s plans for interest rate cuts. Daniel Pavilonis, senior market strategist at RJO Futures, commented that the gold market is hovering just above the $2,000 mark, with Read More…
Crude Oil Futures (CL) quickly turning bullish
Weekly Chart Analysis: Looking at the weekly chart, we observe that Light Crude Oil Futures have recently bounced off a consolidation zone around the $74.88 level, indicating a potential bullish breakout. Last week’s candlestick closed above this zone, and this week’s candle is turning green already. A sustained hold above $74.00 could see us targeting Read More…