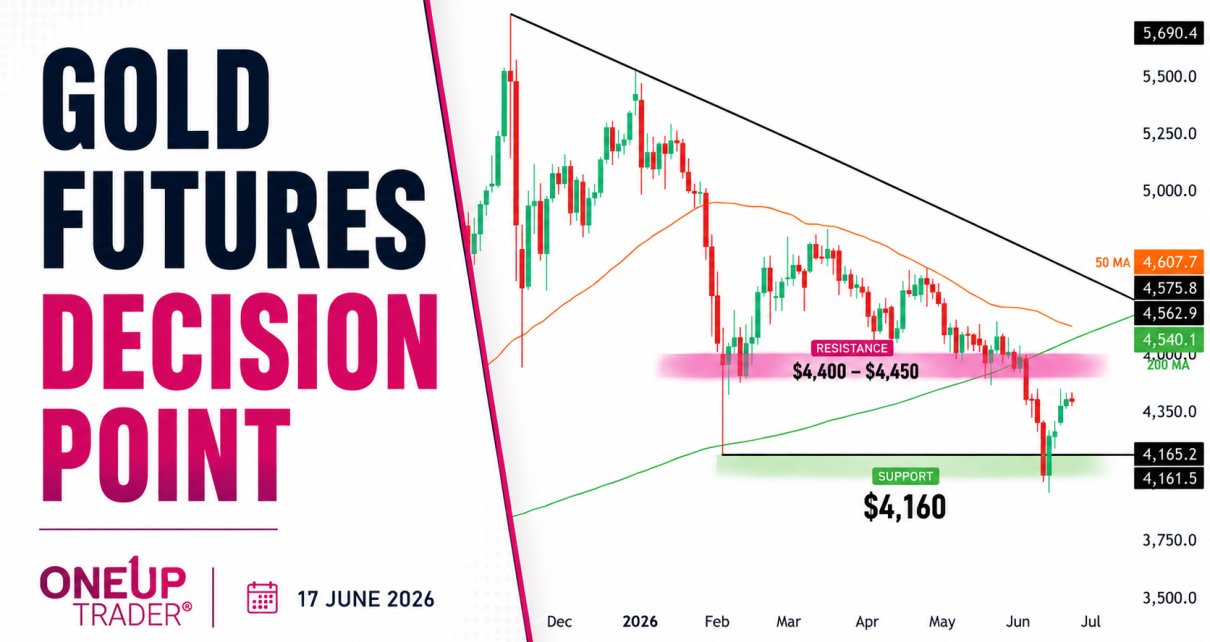
Crude Oil Futures
Fundamental Analysis

Oil Prices Slide Despite Crude Inventory Drawdown, Dovish Fed

Oil prices fell on Wednesday despite a draw in crude inventories and the Fed maintaining its rate-cut outlook. Moreover, investors remained worried about supply disruptions in Russia as the war continued. Oil prices rallied in the previous two sessions due to these supply concerns. Therefore, the pause on Wednesday could have been due to profit-taking. Read More…

futures trading strategies for beginners
Technical Analysis

Bitcoin pulls back, bulls buy it back: Technical Analysis

Daily Chart:A potential reversal candle is forming after the recent downturn we have seen in Bitcoin. The Awesome Oscillator shows a decrease in momentum, highlighted by the shrinking green bars turning red. BTC has been on a tear, up over 50% for the year. A pullback was going to come eventually but the question is Read More…

Fundamental Analysis

Gold Prices Fall as Fed Meeting Looms

Gold prices dropped on Tuesday amid a stronger dollar as markets awaited the Fed monetary policy meeting. A stronger dollar makes gold expensive for foreign buyers, hurting demand. The dollar strengthened amid speculation that the Fed would revert to its hawkish tone after inflation beat forecasts. Initially, gold had rallied to record highs after Powell Read More…

world stocks recovery
Fundamental Analysis

Equities Rally on the Strength of Mega-Cap Giants Alphabet and Tesla

Equities closed Monday in the green after a rally in mega-cap stocks like Alphabet and Tesla. However, there was caution as investors looked forward to the FOMC policy meeting, which will affect rate cut expectations. The rally in mega-cap stocks came due to several factors. However, the main one was AI optimism. Notably, Nvidia soared Read More…

Technical Analysis

S&P 500 E-mini Futures Technical Analysis

Weekly Chart Analysis:ES is trading above its weekly pivot point, with immediate support at 4492.00 USD. The RSI is in the overbought territory, showing strong bullish momentum. The next resistance levels are R1 at 5169.50 USD and R2 at 5519.00 USD. Daily Chart Analysis:A potential bearish divergence is creating some worry for bulls as the Read More…

Crude oil (CL) futures
Technical Analysis

Crude Oil Futures (CL) Technical Analysis

Crude Oil Weekly Chart The weekly shows significant support around the $67 level, which has been tested multiple times since mid-2021, establishing it as a ‘Huge Support’ zone. The volume profile on the left shows a lot of trading activity around these levels, painting the point of control within that support zone. Bears have not Read More…