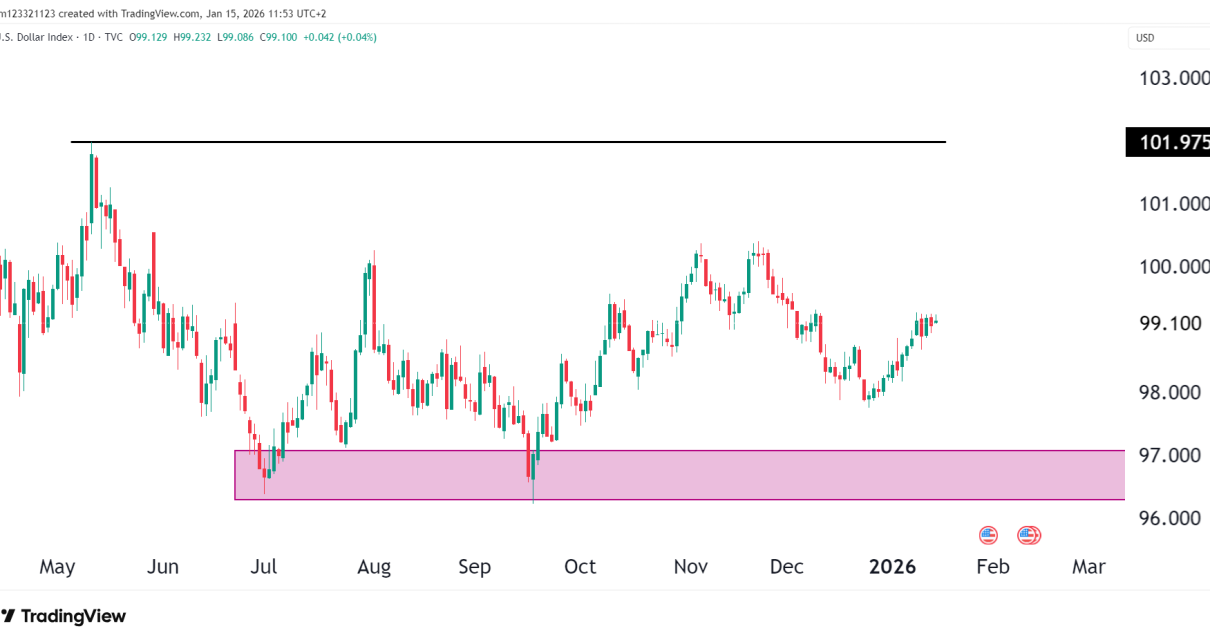
Current Market Snapshot: Chart Technicals Double Bottom Formation Emerging Downtrend Break Under Scrutiny Moving Averages 🐂 Bullish Scenario If NQ can break and close above the descending trendline and 19,000, we have a confirmed breakout of the short-term downtrend channel. Targets on the upside: This setup would turn the recent price action from a bounce Read More…
Tag: Future Trading Tips
Equities Slide as Questions Mount Over Fed’s Independence
Equities collapsed on Monday as more uncertainty rocked investors. Trump’s recent attack on the Federal Reserve has raised concerns about the independence of the institution. Meanwhile, the ongoing trade war with China has increased the likelihood of a rapid economic slowdown in the US. As a result, investors are rushing to safer markets. On Friday, Read More…
Pin Bar Candlestick Pattern in Trading
Introduction The pin bar is one of the most powerful and widely-used candlestick patterns in technical analysis. Found in every market and on every timeframe, the pin bar can signal trend reversals, continuations, and breakouts. But what exactly is a pin bar, how do you identify one, and most importantly, how do you trade it Read More…
Currency Futures Rise as Confidence in US Economy Wanes
Currency futures rallied on Monday as the dollar weakened, with investors losing confidence in the US economy. The move followed reports that Trump plans to shake up the Fed and likely fire Powell, which would further cloud the outlook for the US economy. Dollar spot index (Source: Bloomberg) The dollar resumed its decline on Friday Read More…
Euro Continues to Surge on Weakening USD
Weekly Chart Daily Chart Technical Key Points Indicator/Zone Status Reflection Weekly Fib 61.8% Cleared Major bullish technical trigger Weekly MACD Bullish cross Strong momentum confirmation Daily SMAs Bullish trend Golden Cross formation Daily RSI Overbought but stable Caution for minor pullbacks, not trend reversal Pivot Structure Breaking R2 toward R3 Signs of powerful trend continuation Read More…
NASDAQ-100 (NQ) Technical Analysis – April 18, 2025
Weekly Chart Daily Chart Technical Key Points Indicator/Zone Status Situation Rising Channel Bearish Break Bulls still have a chance to reclaim it Weekly RSI Oversold and rebounding Classic setup for a relief rally Daily SMAs Bearish cross (death cross) Headwind on rallies Volume Profile Heavy support under 17,500 High-probability defense zone Bullish Scenario Upside Targets: Read More…