
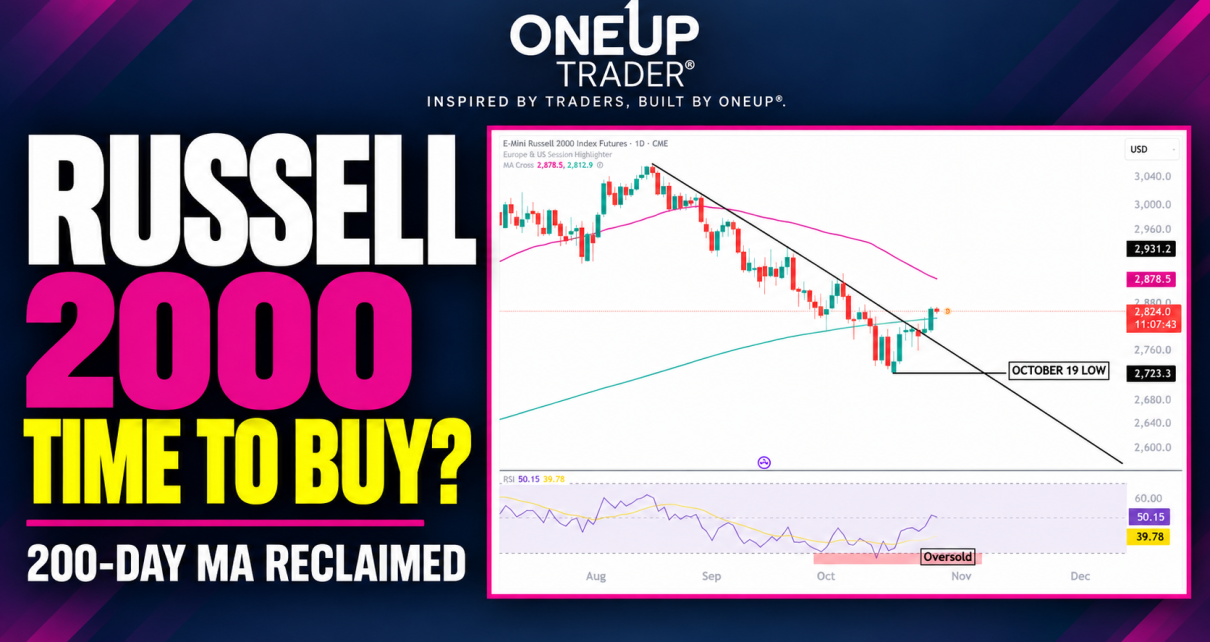
Introduction The Russell 2000 has still been underperforming its big brothers, but there might be a reversal just on the horizon for the small caps. RTY dropped 12% from its peak made on the 17th of August and, after trading below the 200-day moving average for a few sessions, is now back above it, so Read More…

Tag: E-mini S&P 500 (ES)
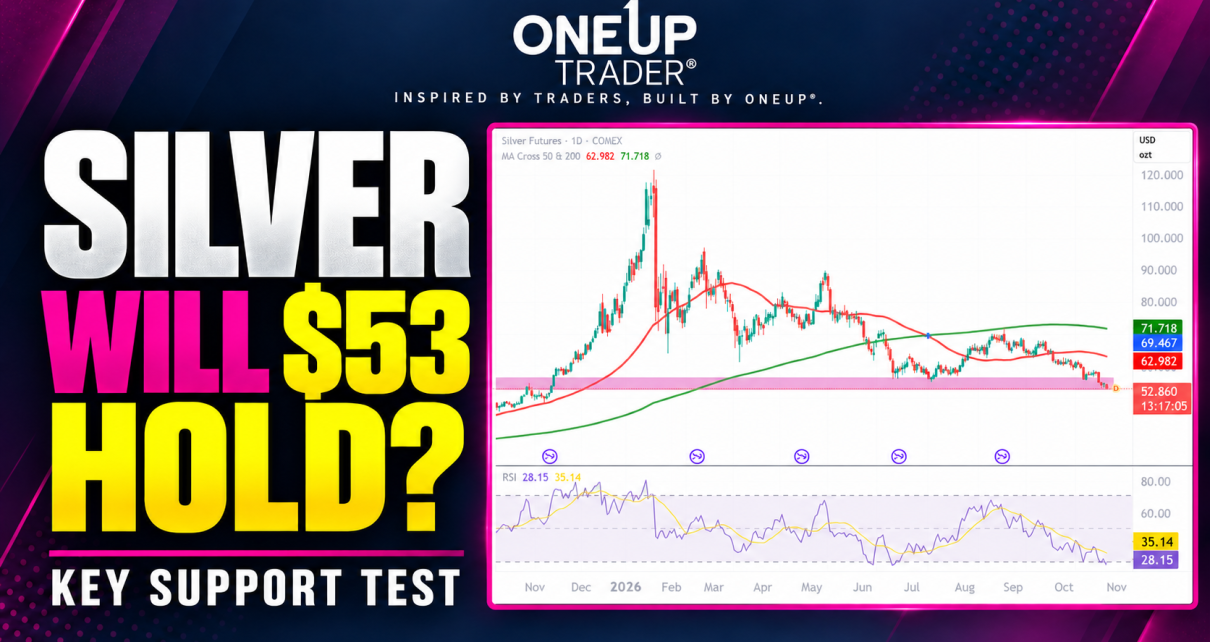
Silver (SI) Technical Analysis: 27 October 2026
Reading time: 4 min Introduction Silver futures are trading near $52.86, testing the lower edge of the $53–$56 support zone after another leg lower. We could say that the price has already broken lower depending on how you draw the support zone. Silver has already dropped below the 2025 October low, and bulls who were Read More…
How Alexander Passed His $50K Evaluation with a 51% Win Rate
Introduction It is time for another funded trader success story, and today, we are looking at Alexander, a trader from Palmira, Colombia, who passed the $50K evaluation with OneUp Trader. The freelance designer has four years of trading experience and has been with us since June 2025. His evaluation report shows $3,129 in profit across Read More…
Equities Recover as Oil Prices Fall on Russian Supply Hopes
Equities rebounded on Monday as oil prices eased amid expectations for increased fuel supply from Russia. The recovery came after a bearish week, as market participants absorbed inflation and sales data pointing to a more hawkish outlook for the Fed. Reports revealed that the Trump administration had lifted key sanctions on Russia. Traders cheered the Read More…
Paul Tudor Jones: 6 Trading Lessons That Help You Stay in the Game
Estimated reading time: 7 minutes Introduction A trader can spend the whole day looking for the right entry and still lose the account because of what happens after the trade goes wrong. The stop gets moved, another contract gets added, and a manageable loss turns into something that blows the account. This is where Paul Read More…
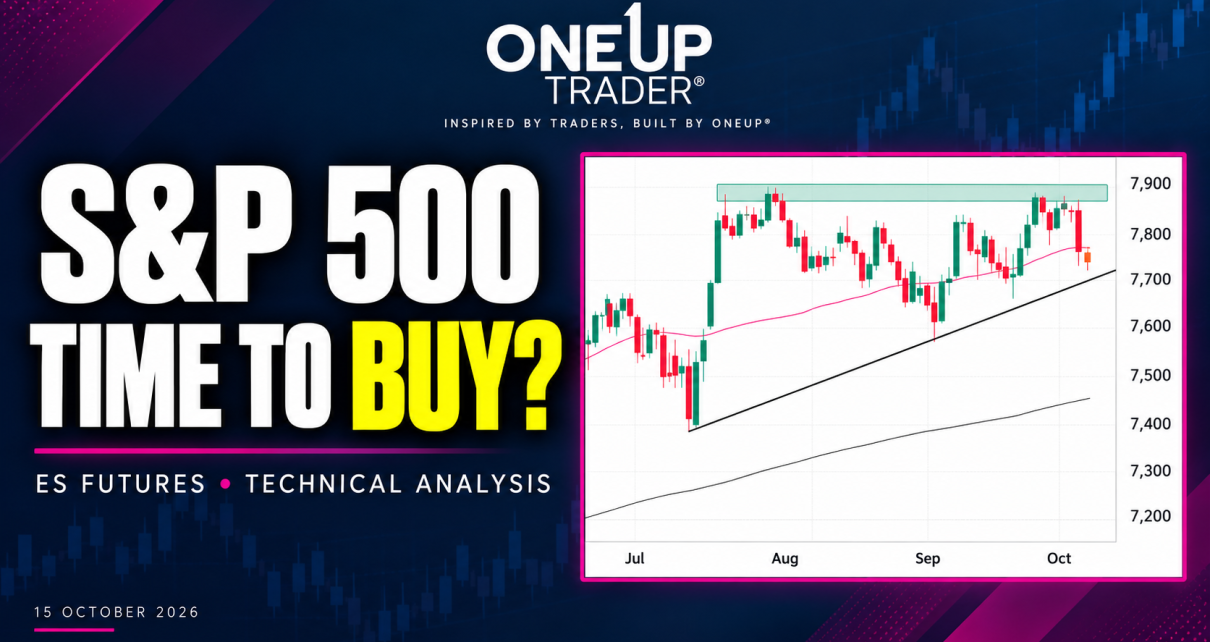
S&P 500 (ES) Technical Analysis: Is This Pullback a Buying Opportunity?
15 October 2026 | Daily and hourly charts Introduction S&P 500 futures have pulled back after another rejection near the 7,890 resistance area, bringing a potential buying opportunity into focus. The broader daily uptrend remains intact, and the latest decline gives traders a reason to start watching the hourly chart for long setups. The question Read More…