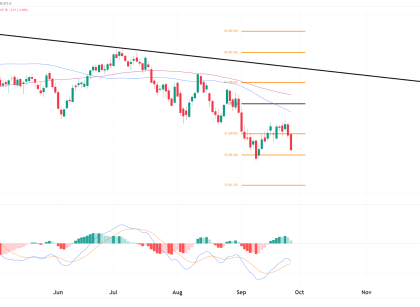
Weekly Chart Analysis: The weekly chart exhibits a consolidation pattern with a clear ‘Point of Control’ at approximately 1.09220. This level represents the price with the highest volume traded over the analyzed period and acts as a significant area of balance between supply and demand. The presence of a ‘Low Volume Node’ below this range Read More…
Tag: crude oil futures (CL)
Frightening evening star pattern on RTY futures
Weekly Chart Starting with the weekly chart, the E-Mini Russell 2000 Index Futures are oscillating within a defined trading range between approximately $1964.5 and $2000, with the ATH at $2463.7. The index is currently testing the upper boundary of this range. A convincing breakout above the range could signal a strong bullish sentiment, potentially targeting Read More…
US Crude Oil Prices Plummet as Stockpiles Soar
On Wednesday, US crude oil prices fell sharply due to an unexpected increase in US crude stockpiles. The report raised concerns about demand in the largest oil market. WTI futures vs crude stockpiles (Source: Bloomberg, EIA) Despite an initial 1% gain, prices reversed direction following the US Energy Information Administration’s report. There was a surprise Read More…
CL Futures at POC – What’s Next for Oil?
Weekly Chart The weekly chart reveals a battle at a critical level for crude oil futures. A well-defined support zone at $71.50-$72.00 comes into focus, clearly marked by previous consolidation and the volume profile ‘point of control.’ This level represents a pivotal battleground between bulls and bears because it tells us that this is the Read More…
Oil Prices Rally 3% on Global Supply Disruption Concerns
On Wednesday, oil prices rose approximately 3% due to a disruption at Libya’s primary oilfield. This incident heightened concerns about potential disruptions in global oil supplies. Moreover, there were escalating tensions in the Middle East. Oil rose for the first time in five days, marking the most significant daily percentage gain for WTI since mid-November. Read More…
Crude Oil Futures (CL) levels and trades
In this week’s technical analysis of Crude Oil we will look at the weekly and daily charts. CL is down 26% since its 2023 peak made in September of last year and is currently trading inside of a support zone. Let’s see what the charts say and if we can find some opportunities. Weekly Chart Read More…