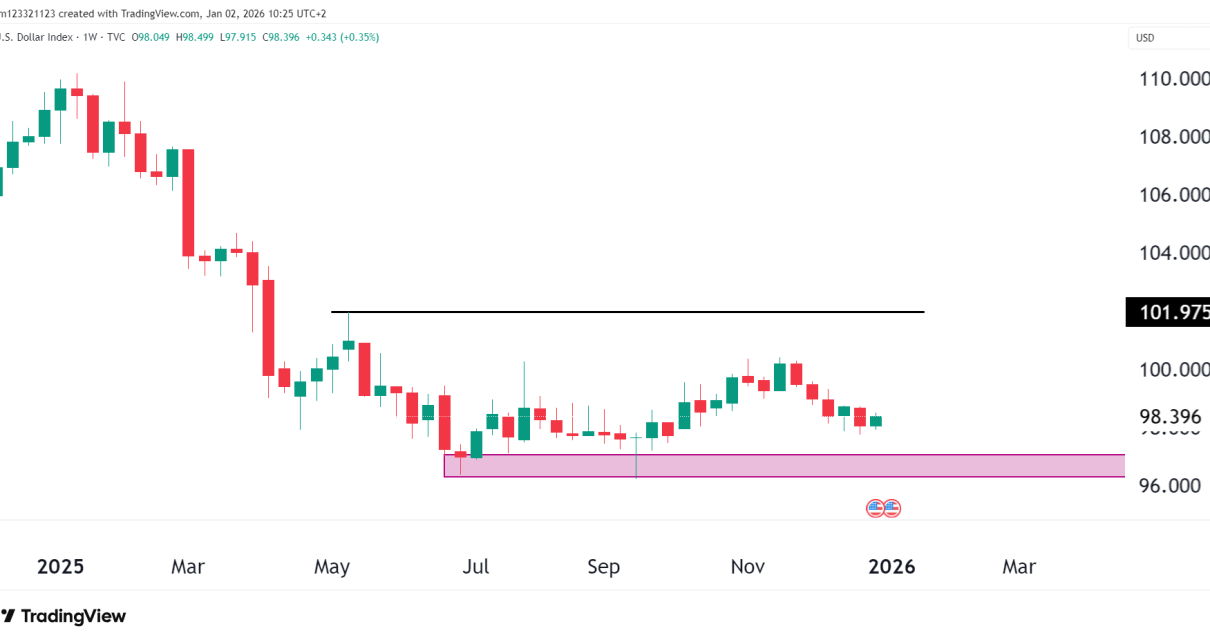
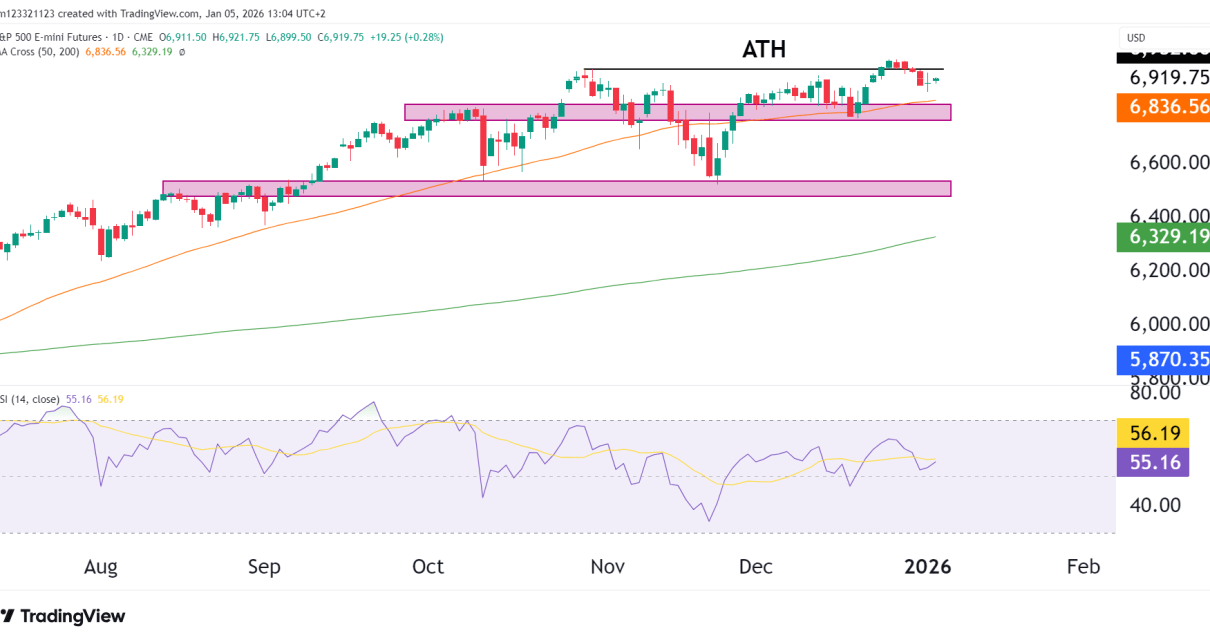
Technical Analysis

S&P 500 E-mini Futures (ES) – Rally Grinds Higher, ATH in Sight?

Price Action & Structure Recap of the Recent Setup Technical Indicators Moving Averages Adaptive Momentum Oscillator (AMO) This indicator shows bullish strength, but watch for potential divergence if ES fails to break above R1 (~5,962) soon. Key Technical Zones Level Price Role R2 / ATH Target ~6,170–6,338 Long-term measured move / fib cluster R1 5,962.75 Read More…

Technical Analysis

Euro FX Futures (6E) – Is the Pullback Over?

Technical Analysis Bullish Structure Intact The Euro surged from below 1.08 in Q1 to above 1.16 in mid-April, breaking through several key resistance levels. The most recent pullback appears to have: Resistance and Key Levels The key technical battlegrounds now are: A daily close above 1.1300 would shift momentum strongly back in the bulls’ favor Read More…

crude oil technical analysis
Technical Analysis

Crude Oil Futures (CL) Bounce Underway, But Resistance Looms

Technical Analysis Double Bottom or Bear Flag? Crude oil has bounced sharply from the $55–56 area and is now testing the lower edge of a confluence resistance zone marked by: The $55.12 level remains as support. This pattern could be interpreted as either: RSI and Momentum Pivot Levels & Context Key Levels Type Price Area Read More…

Russell 2000
Technical Analysis

Russell 2000 (RTY) – Are Small Caps Ready to Rally?

Technical analysis Price Action: Moving Averages: Key Levels to Watch Type Price Note Resistance 2,050–2,070 Previous swing highs / congestion zone Resistance 2,192 200-day MA Support 1,995 50-day MA support Support 1,850–1,880 April low and major support zone Broader Context – Small Caps Lag, But Are They Catching Up? Bull Case Bear Case Final Call Read More…

Gold futures GC daily chart
Technical Analysis

Gold Futures (GC) – Is the Rally Getting a Second Wind?

Price Snapshot (as of May 6, 2025): Technical Analysis Trend Moving Averages RSI Momentum Key Price Levels Type Level Notes Support $3,110 50-day MA & breakout pivot Support $3,000 Psychological round level Resistance None Blue sky breakout Extension $3,500–3,650 Measured move from breakout flag Why Is Gold So Strong? Drivers Behind Gold’s Outperformance Bear Case? Read More…

crude oil technical analysis
Technical Analysis

Crude Oil Futures (CL) – Bearish Price Action

Overview: Weekly Chart Technicals: Structure Breakdown RSI Analysis Daily Chart Technicals: Downtrend Intact RSI Key Levels: Type Level Note Resistance $65.00–66.00 Breakdown retest zone (failed) Resistance $70.00 200-day MA + descending trendline Support $55.16 Horizontal support, 2024 low Support $51.46 Measured move + next pivot (S1) Probability Outlook Scenario Probability Trigger Break below $55 → Read More…