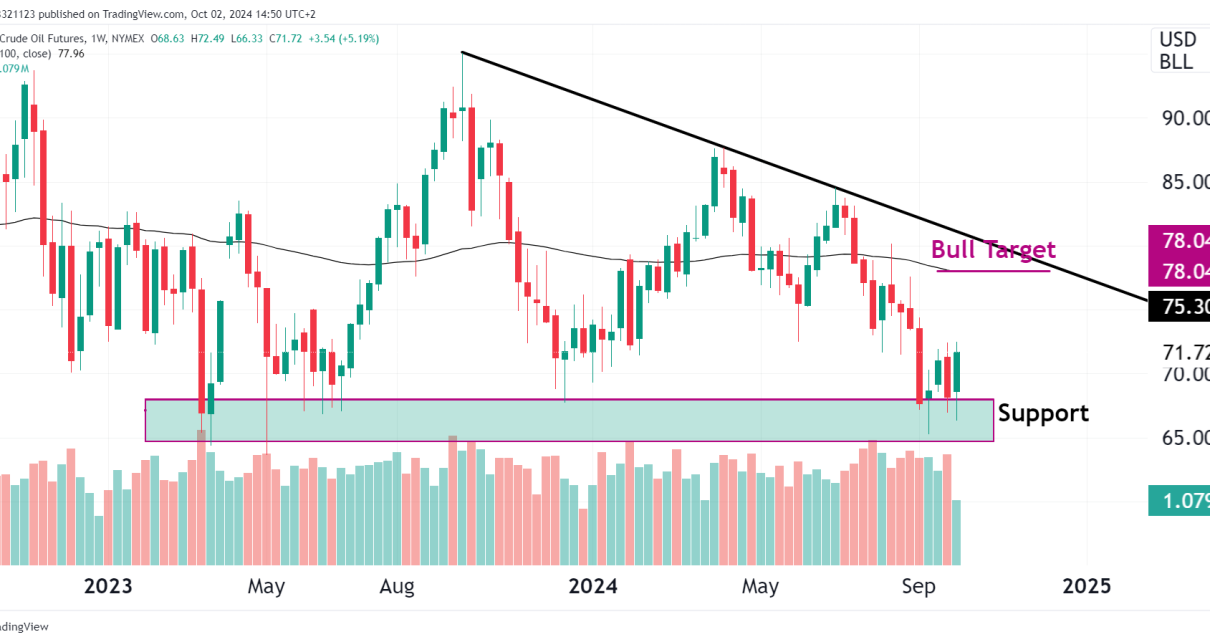
Introduction ES has broken above its all time high once more as bulls have gained the upper hand. There are some important levels to keep an eye on for the daily chart and possible entries we could look for. Currently, we don’t see any bearish trade opportunities. Technical Analysis Price Action Moving Averages Relative Strength Read More…
Technical Analysis
NASDAQ Futures (NQ) Massive Bullish Candle
Introduction The Nasdaq e-mini futures (NQ) painted a huge bullish candle from last Friday in the form of a doji that is busy confirming a morning star pattern. The price has already pushed above last Friday’s high, confirming the bullish price action. The doji from Friday also bounced right off the 100 MA. This could Read More…
Gold Futures Market Update, Technical Analysis
Key Updates For Gold Futures Current Prices and Trends: Gold futures are currently trading around $2,364.75 per ounce. The market has experienced some volatility, with prices ranging between $2,358.30 and $2,369.00 in recent trading sessions (Investing.com). Market Sentiment: Analysts note a bearish sentiment in the near term, with key support levels under threat. This outlook Read More…
Did S&P 500 (ES) Just Double-Top?
Introduction In our previous analysis on ES, we noted that the bulls were struggling to push price above the recent high and resistance zone at $5333. Now that a week has passed, the bears have stepped in and there is a red engulfing candle forming on the weekly chart that could close as a evening Read More…
NASDAQ Futures (NQ) Bearish Divergence?
Introduction The Nasdaq 100 futures are currently trading around 18,876.75. Over the past month, the index experienced a gain of approximately 5.76% since late April (Barchart.com). This performance is driven by strong corporate earnings from major tech companies like Nvidia and Microsoft, which have posted better-than-expected results. Nvidia’s surge of 9% following earnings and optimistic Read More…
Crude Oil Futures (CL) bounce, long opportunity
A quick recap on our CL analysis done earlier in the week needs to be done as CL has failed to break below the support zone. The bulls stepped back in and the chart has put in a solid bottom candle formation. If we grind down to a shorter time frame, there is a false Read More…


