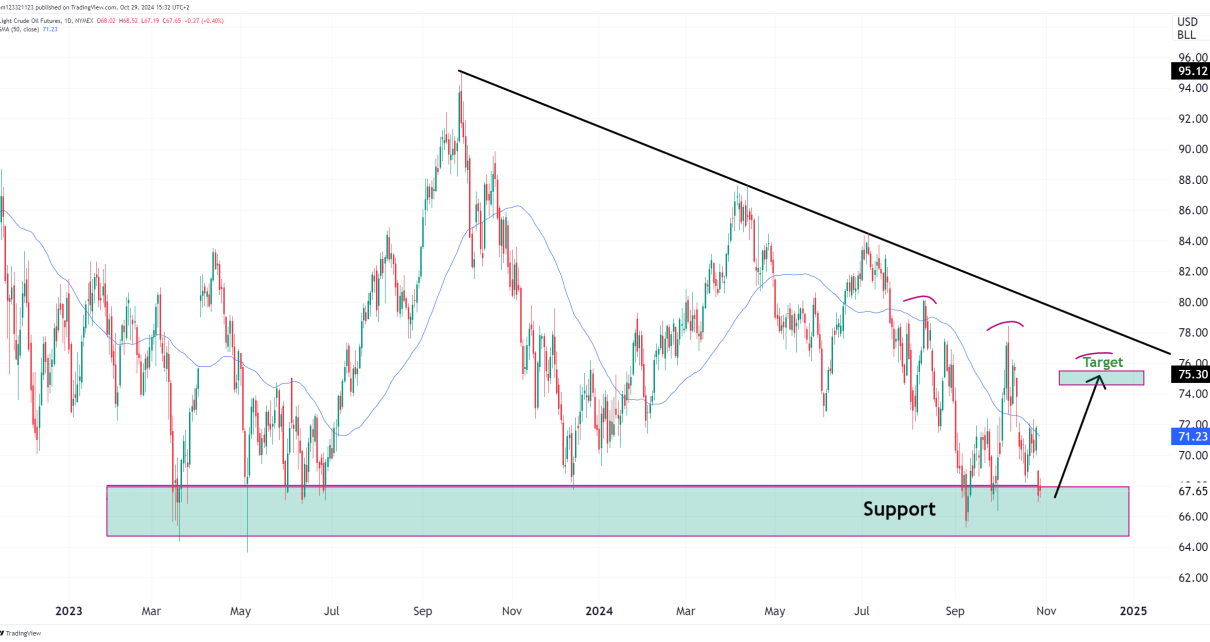
Weekly Chart Analysis: The weekly chart exhibits a consolidation pattern with a clear ‘Point of Control’ at approximately 1.09220. This level represents the price with the highest volume traded over the analyzed period and acts as a significant area of balance between supply and demand. The presence of a ‘Low Volume Node’ below this range Read More…
Technical Analysis
Bullish price action in Dollar (DXY)
Weekly Chart We observe a clear support zone around the 102.00 level, which price is currently testing. If we see a strong bullish response at this zone, we could anticipate a rally towards the upper resistance near 114.90. However, a break below this support could lead us to look for further downside targets near the Read More…
Frightening evening star pattern on RTY futures
Weekly Chart Starting with the weekly chart, the E-Mini Russell 2000 Index Futures are oscillating within a defined trading range between approximately $1964.5 and $2000, with the ATH at $2463.7. The index is currently testing the upper boundary of this range. A convincing breakout above the range could signal a strong bullish sentiment, potentially targeting Read More…
CL Futures at POC – What’s Next for Oil?
Weekly Chart The weekly chart reveals a battle at a critical level for crude oil futures. A well-defined support zone at $71.50-$72.00 comes into focus, clearly marked by previous consolidation and the volume profile ‘point of control.’ This level represents a pivotal battleground between bulls and bears because it tells us that this is the Read More…
E-mini Dow Jones Futures Technical Analysis
Taking a top-down approach, the weekly time frame shows price exhibiting strong bullish momentum as it rapidly approaches the new all-time highs around 37822 after the previous was broken. The weekly RSI reads 58.82, reflecting neither overbought nor oversold conditions yet and indicating additional room likely remains for this uptrend to continue before exhaustion risk Read More…
Gold Futures (GC) multi-timeframe analysis
The weekly chart shows a triple-top reversal pattern forming, with resistance around $2088. This is a pivotal zone – if price can break out above $2088 decisively, it would invalidate the bearish pattern and imply an upside breakout. However, failure to break resistance could confirm the pattern and precede a downward move. The weekly RSI Read More…