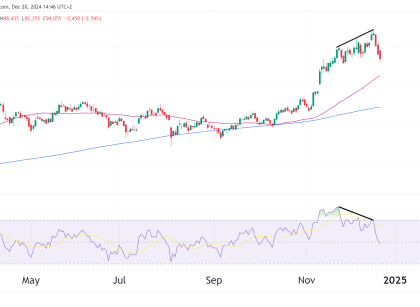
Current Trend and Price Action Moving Averages The price is currently hovering near the 200-day moving average (around 2,100). The 50 MA is at the same price and is acting as additional support to the price for now. Support and Resistance Zones Volume Considerations Probable Scenarios Bullish Scenario: Bearish Scenario: If you have any technical Read More…
Technical Analysis
Short Trade Opportunity on Euro Futures (6E)
Weekly Chart The Euro 6E futures were rejected after moving into the resistance zone at 1.10265. This zone has successfully stopped the bulls from pushing prices higher since the start of 2023, and this may present us with a short opportunity. Let’s look at the daily chart first, though. Daily Chart Short Trade Opportunity in Read More…
Are S&P 500 (ES) Futures Ready to Rocket?
Introduction The S&P 500 (ES) chart, along with other US indices, recently had a correction of around 10% from the high. Some are calling this to be a simple pullback, while others think it’s the signal of much worse things to come. Violent and concerning geopolitical concerns worldwide are likely contributing to the recent profit-taking. Read More…
Bitcoin Crashes 14% in early Monday trade
Introduction Bitcoin has plunged to levels not seen since February, briefly dipping below the $50,000 mark. This dramatic sell-off comes just days after Bitcoin was flirting with the $70,000 level. This is part of a broader market sell-off triggered by renewed recession fears, as even the big indices started falling on Monday. Investors, already on Read More…
Crude Oil Futures (CL) Surges on EIA Report
Introduction CL Futures saw a huge rally of 5% yesterday as the EIA showed a larger than expected drawdown in stock piles. This has given bulls new hope that CL can break above $80 and possible head toward $100 in the future. Recent News Geopolitical Tensions: Escalating geopolitical tensions in the Middle East raised concerns Read More…
Russell 2000 Futures could blast past ATH next week
Introduction We looked at the break out in RTY two weeks back, and now, the daily chart is forming a pennant chart pattern. The penant formation is a high probability chart pattern that can lead to a big swift move initially which is why we think we could see RTY break its ATH next week or the Read More…


