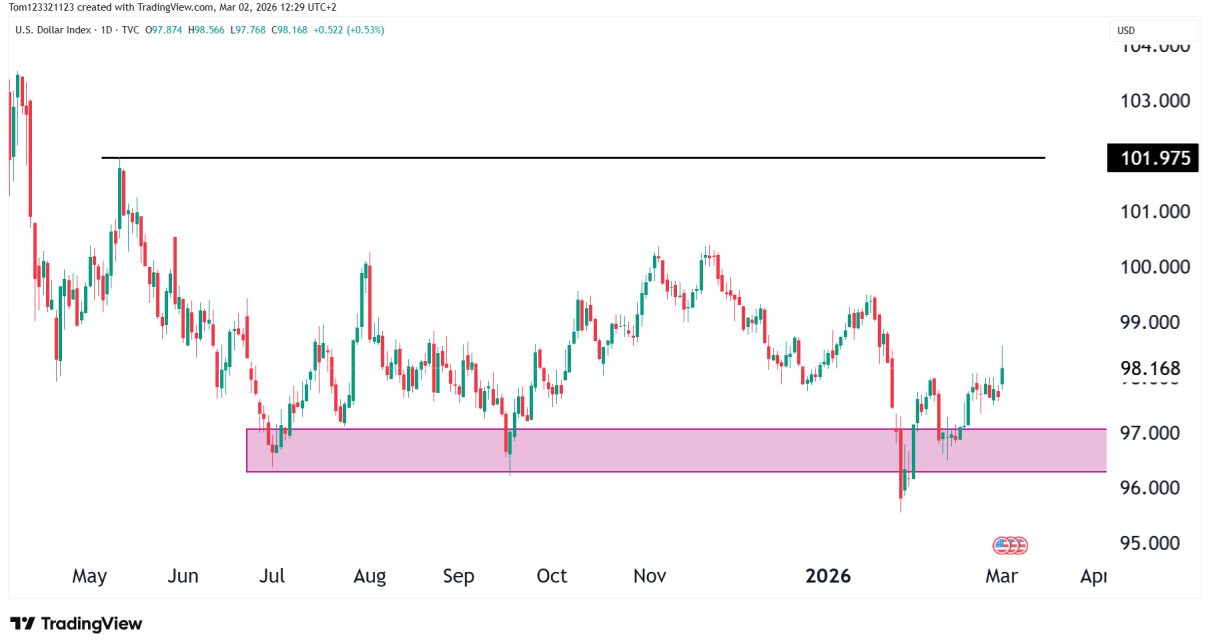
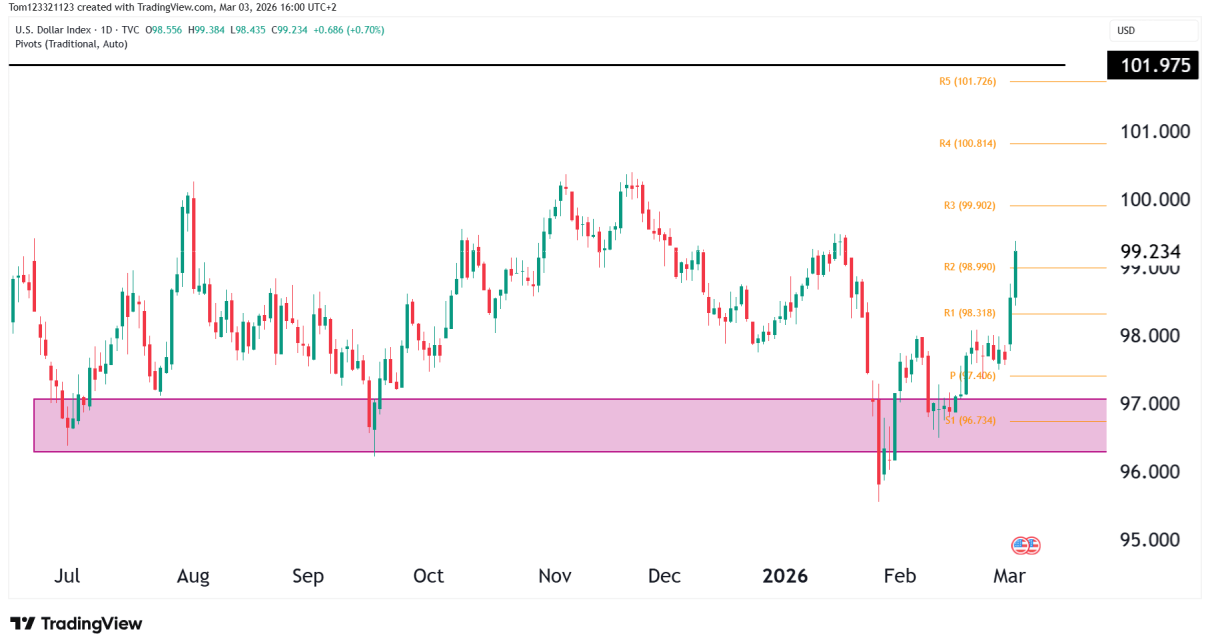
Introduction Gold futures (GC) have been consolidating near all-time highs, with price action stalling after eight consecutive bullish weekly candles. The market showed momentum only last Tuesday, while the rest of the week saw sideways movement. Despite this consolidation, the weekly close remained bullish, keeping the long-term uptrend intact. As of now, gold is trading Read More…
Technical Analysis
Dow Jones futures test bullish trendline
Introduction E-mini Dow Jones futures (YM) have rebounded off trendline support, regaining strength after a recent pullback. Price tested the ascending trendline and the 100-day VWMA (43,610), holding above these levels and keeping the long-term uptrend intact. Market Drivers & Key News Events Technical Analysis Bounce from Trendline—Higher Lows Intact Key Support & Resistance Levels Read More…
Japanese Yen(6J) technical analysis 21/02/2025
Introduction Japanese Yen futures (6J) have been in a strong recovery since bottoming near 0.0061830, pushing through key levels and reclaiming the 100-day VWMA (0.0065776). However, price has now reached a major resistance zone near 0.0066630, where previous rallies have failed. As of today, 6J is trading at 0.0066630, down -0.46%, with price stalling just Read More…
S&P 500 ATH on the Cuspe of Bullish Break
Introduction S&P 500 E-mini futures (ES) are trading just below their all-time high (ATH) of 6,154.75. As of today, ES is less than 0.2% away from ATH. A breakout above 6,154.75 would confirm the next leg higher, with a measured move target near 6,455.25. Market Drivers & Key News Events Technical Outlook ATH Test Bull Read More…
Russell 2000 hold key support—is a breakout coming?
Introduction The Russell 2000 E-mini futures (RTY) are inside a bullish rising channel, despite recent choppy price action. Small-cap stocks have struggled for direction, but the 100-day SMA (2,299.9) trending upward steadily. As of today, RTY is trading at 2,289.2, up +0.17%, hovering near key pivot levels. Bulls are looking for a decisive move higher, Read More…
NASDAQ 100 (NQ) futures break triangle formation
Introduction The NASDAQ 100 E-mini futures (NQ) have broken out of a symmetrical triangle pattern. After weeks of consolidation, price action shows that buyers are regaining control, pushing NQ towards its all-time high (ATH) of 22,425.75. As of today, NQ is trading at 22,135.75, up +0.10%, holding above key support levels. The breakout above the Read More…