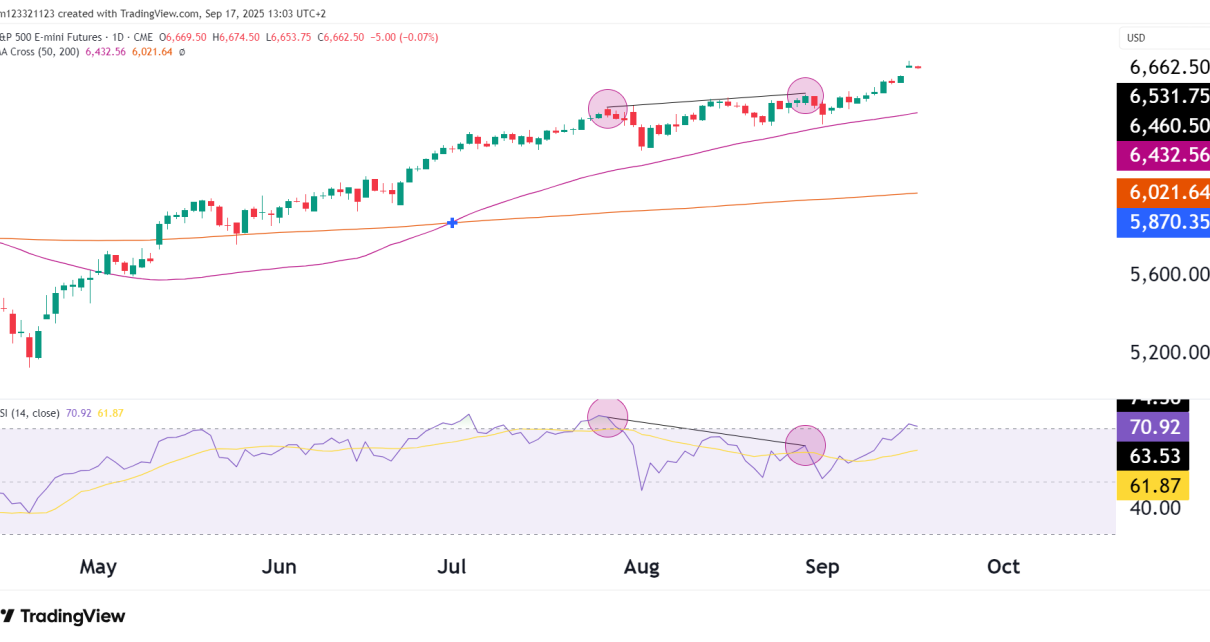
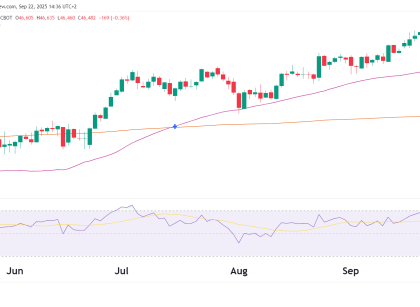
Introduction In our previous analysis, we anticipated a potential breakout in crude oil futures (CL) if the price could sustain momentum above certain resistance levels. Since then, crude has rallied sharply but failed to hold above the descending trendline resistance, leading to a pullback below the trendline again. Let’s see what the technicals are telling Read More…
Technical Analysis
Nikkei 225 (NKD) futures stuck in tight range
Introduction Nikkei 225 E-mini Futures (NKD) have been trading within an ascending channel since September 2024. A breakout above 39,958, could pave the way for a test of the all-time high (ATH). Lets take a deeper look at the technicals. Technical analysis overview Channel Structure Support and Resistance Levels Resistance Levels (Upside Targets) Support Levels Read More…
Russell 2000 futures (RTY) technical analysis
Introduction In our previous analysis on January 8, 2025, the expectation was for RTY futures to hold within the established bullish channel, with the support levels acting as a springboard for further upside. Since then, price action has respected the lower boundary of the channel, and the recent bounce confirms the bullish structure remains intact. Read More…
NASDAQ 100 technical analysis – January 21, 2025
Introduction The NASDAQ 100 E-mini Futures (NQ) are trading at 21,703.75, continuing their upward trajectory following the recent inauguration of President Trump. Traders and investors are pricing in optimism on pro-growth economic policies, contributing to the strength in equities. Technical Analysis Overview Trend and Structure: Support and Resistance Levels Resistance Levels: Support Levels: Indicators Analysis Read More…
Gold futures technical analysis – January 17, 2025
Introduction Gold futures (GC) are trading at $2,730.7, consolidating near the upper boundary of a symmetrical triangle pattern. Despite briefly testing the breakout zone, the move lacks strong follow-through, leaving the potential for a retracement back toward the triangle’s support line. Both bullish and bearish scenarios remain in play, and traders should monitor critical levels Read More…
S&P 500 (ES) daily technical analysis – January 16, 2025
Introduction Since our last analysis, the S&P 500 E-mini Futures (ES) have rebounded sharply, reclaiming support levels and re-entering the ascending channel that has held price action since mid-2024. This bullish reversal shifts the outlook as buyers regain control, but the path to the All-Time High (ATH) at 6,154.75 remains a difficult one to predict. Read More…