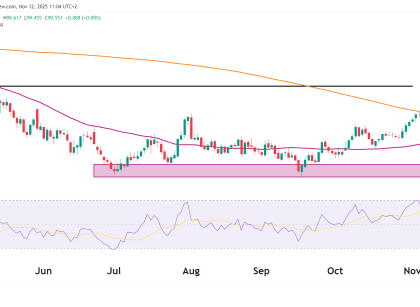
Technical Analysis

NASDAQ Futures (NQ) Dead Cat Bounce?

Current Market Snapshot: Chart Technicals Double Bottom Formation Emerging Downtrend Break Under Scrutiny Moving Averages πŸ‚ Bullish Scenario If NQ can break and close above the descending trendline and 19,000, we have a confirmed breakout of the short-term downtrend channel. Targets on the upside: This setup would turn the recent price action from a bounce Read More…

futures trading strategies for beginners
Technical Analysis

Bitcoin Futures (BTC) Technical Analysis – April 22, 2025

Technical Analysis Bitcoin has spent the past several weeks grinding out a bottom, forming a rounded base pattern just above the critical 78,000–80,000 support. This basing action has been healthy β€” no panic selling, rising volume, and a higher low structure formed. BTC is breaking above the key 87,000 level and testing the upper edge Read More…

Technical Analysis

Euro Continues to Surge on Weakening USD

Weekly Chart Daily Chart Technical Key Points Indicator/Zone Status Reflection Weekly Fib 61.8% Cleared Major bullish technical trigger Weekly MACD Bullish cross Strong momentum confirmation Daily SMAs Bullish trend Golden Cross formation Daily RSI Overbought but stable Caution for minor pullbacks, not trend reversal Pivot Structure Breaking R2 toward R3 Signs of powerful trend continuation Read More…

weekly NQ technical analysis chart
Technical Analysis

NASDAQ-100 (NQ) Technical Analysis – April 18, 2025

Weekly Chart Daily Chart Technical Key Points Indicator/Zone Status Situation Rising Channel Bearish Break Bulls still have a chance to reclaim it Weekly RSI Oversold and rebounding Classic setup for a relief rally Daily SMAs Bearish cross (death cross) Headwind on rallies Volume Profile Heavy support under 17,500 High-probability defense zone Bullish Scenario Upside Targets: Read More…

Technical Analysis

S&P 500 Futures (ES) Bulls & Bears Fight It Out

Current Technical Picture What Has Changed Since the Last Analysis? In our previous breakdown (April 4th analysis), we highlighted: Since then: Key Levels to Watch Bullish Case Bearish Case Sentiment: Dead Cat Bounce or New Uptrend? The market has staged a technical recovery, but from a broader macro and technical perspective, this still looks like Read More…

DXy technical analysis dollar
Technical Analysis

Is It Over for the Dollar? Death Cross SMAs Raise Red Flags

Asset: U.S. Dollar Index (DXY)Timeframe: DailyπŸ“† Date: April 16, 2025πŸ’° Current Price: 99.53 Macro + Technical Overview The U.S. Dollar is under significant pressure, now trading below the critical 100 psychological level and hovering around a key support zone (~99.00–99.50) that dates back to mid-2023. Adding weight to the bearish tone is a textbook β€œdeath Read More…