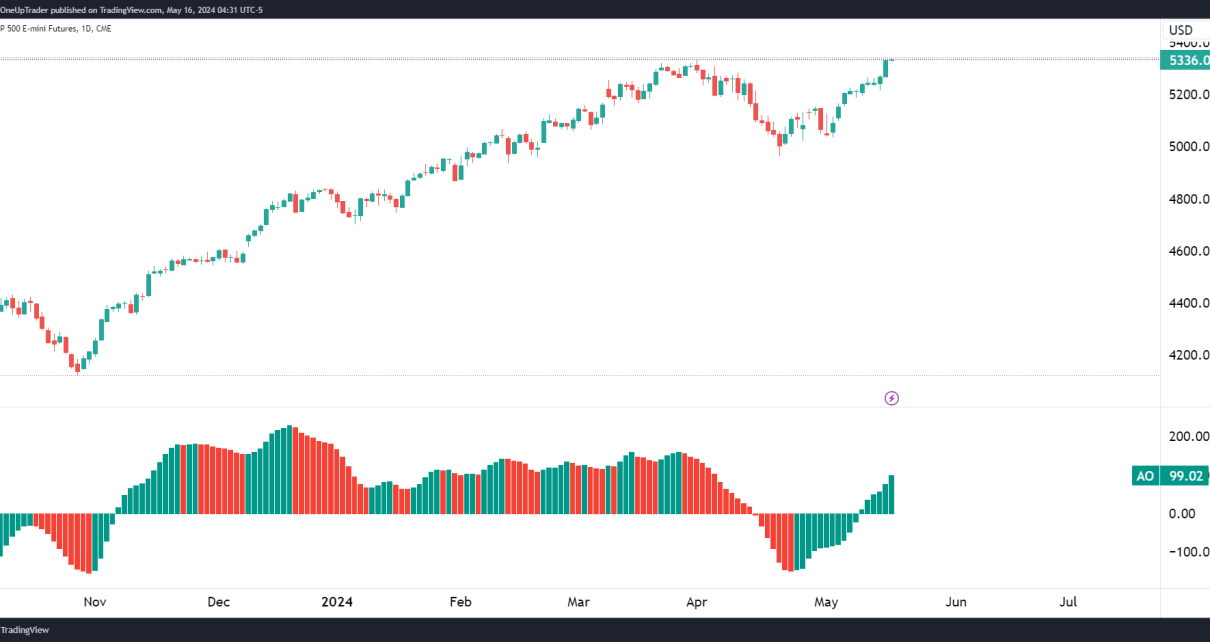
Introduction The S&P 500 Futures (ES) has rebounded from its recent 7% pullback and broke above the all-time high on May 15th. Technicals look bullish and follow a trend. We can begin grinding down to shorter time frames, avoid looking for shorts, and focus solely on looking for longs on our short-term strategies. Why Daily Read More…
Analysis
Gold Prices Recover as Demand Rises on Declining US Treasury Yields and Dollar
Gold prices recovered on Tuesday as demand rose due to a decline in US Treasury yields and the dollar. This decline came after the US released an upbeat wholesale inflation report that had the opposite effect on prices. At the same time, gold was stronger as Powell maintained his outlook that inflation would decline, hence Read More…
Equities Dip Slightly as Investors Cautiously Await US Inflation Data
Equities ended slightly lower on Monday as investors stayed on the sidelines ahead of US inflation data. At the same time, they were preparing to receive the earnings reports of major US retail companies. This week, the US will release several important reports, including wholesale inflation, consumer inflation, and retail sales. All these will significantly Read More…
Dow Jones Futures (YM) Technical Analysis & Trades
Dow Jones Futures (YM) have slightly underperformed by about 5% vs. ES and NQ, but nevertheless, the trend is bullish. The key feature on the daily chart is the ascending triangle formation, which gives us a target at the 200% FIbo level. This is the bullish target for the medium term. Keep an eye out Read More…
Currency Futures Slide as Markets Expect Hotter US Inflation
Currency futures dropped on Friday as the dollar gained strength on higher US inflation expectations. At the same time, investors absorbed comments from Fed policymakers regarding interest rates. Meanwhile, US consumer sentiment fell. Data on Friday from the University of Michigan revealed a decline in consumer sentiment. The figures came in at 67.4 in May, Read More…
Crude Oil Futures (CL) Found a Technical Floor?
Introduction CL ended last week with a spinning top formation on the weekly chart after a fairly small range of trading. Volume was also slightly below the weekly average telling us that there was indecision in the market and a potential move coming up that we can capitalize on. The week prior we saw CL Read More…


