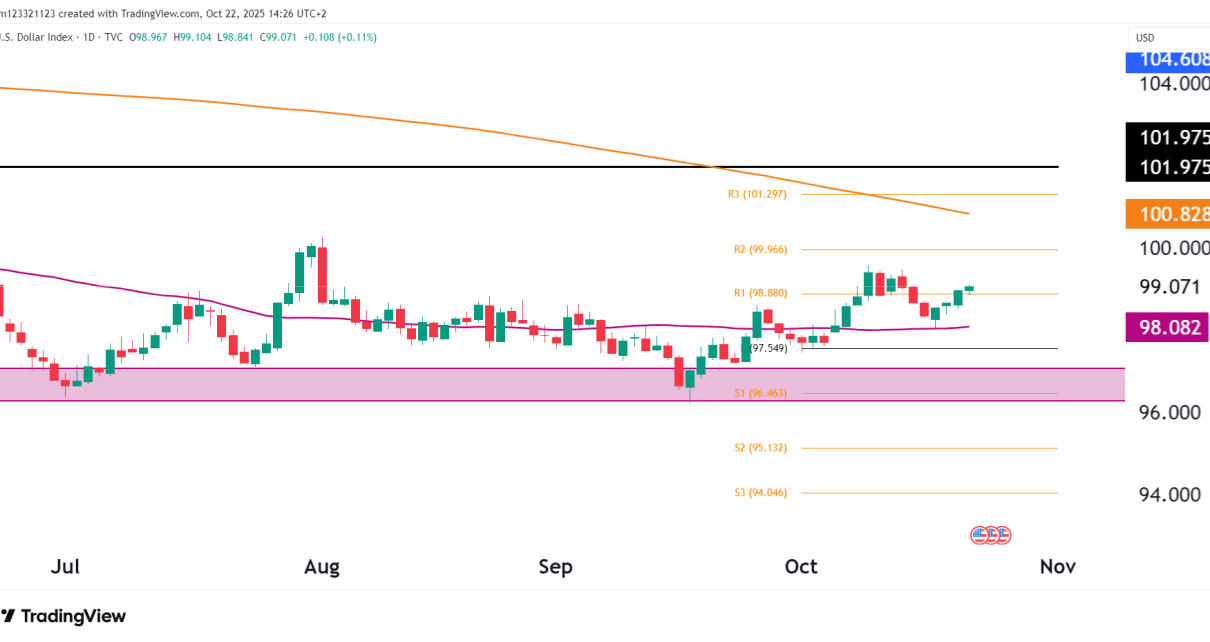
Context: 2025’s Market Chaos Is Gold’s Fuel Gold’s explosive rally has been fueled by macro turmoil: Gold has outperformed equities, bonds, the dollar, and even oil. That alone demands attention. Technical Analysis – Daily Chart Breakdown Trend Structure: Bullish and Intact Flag Formation or Consolidation at Highs? RSI and Momentum Indicators 🟢 Bullish Case Potential Read More…
Year: 2025
Oil Finds Support on Hopes of US-China Agreement
Oil paused its decline on Thursday as sentiment improved on a likely trade deal between the US and China. At the same time, risk appetite improved after Trump stopped his attacks on Fed Chair Powell. However, prices fell over 2% in the previous session on reports that OPEC+ might increase output in June. The US Read More…
S&P 500 Futures (ES) Bounce Short Lived or Start of New Rally?
Recap from the Previous Report In our April 17 technical analysis, we focused on the bounce we saw off the lows in ES, with a breakout attempt through trendline resistance. We can now take a fresh look at the price action and see what could be ahead. Current Chart Overview (April 24, 2025) Market Snapshot Read More…
Gold Slips as Treasury Comments About Easing US-China Trade Fears
Gold extended Tuesday’s decline as risk appetite improved after the US Treasury Secretary’s comments on the US-China trade war. Market participants now expect a de-escalation in the trade war, which is bearish for gold. At the same time, Trump halted his attacks on Fed Chair Powell, further improving investors’ sentiment. Spot gold (Source: Bloomberg) Gold Read More…
NASDAQ Futures (NQ) Dead Cat Bounce?
Current Market Snapshot: Chart Technicals Double Bottom Formation Emerging Downtrend Break Under Scrutiny Moving Averages 🐂 Bullish Scenario If NQ can break and close above the descending trendline and 19,000, we have a confirmed breakout of the short-term downtrend channel. Targets on the upside: This setup would turn the recent price action from a bounce Read More…
Bitcoin Futures (BTC) Technical Analysis – April 22, 2025
Technical Analysis Bitcoin has spent the past several weeks grinding out a bottom, forming a rounded base pattern just above the critical 78,000–80,000 support. This basing action has been healthy — no panic selling, rising volume, and a higher low structure formed. BTC is breaking above the key 87,000 level and testing the upper edge Read More…
Equities Slide as Questions Mount Over Fed’s Independence
Equities collapsed on Monday as more uncertainty rocked investors. Trump’s recent attack on the Federal Reserve has raised concerns about the independence of the institution. Meanwhile, the ongoing trade war with China has increased the likelihood of a rapid economic slowdown in the US. As a result, investors are rushing to safer markets. On Friday, Read More…
Pin Bar Candlestick Pattern in Trading
Introduction The pin bar is one of the most powerful and widely-used candlestick patterns in technical analysis. Found in every market and on every timeframe, the pin bar can signal trend reversals, continuations, and breakouts. But what exactly is a pin bar, how do you identify one, and most importantly, how do you trade it Read More…
Currency Futures Rise as Confidence in US Economy Wanes
Currency futures rallied on Monday as the dollar weakened, with investors losing confidence in the US economy. The move followed reports that Trump plans to shake up the Fed and likely fire Powell, which would further cloud the outlook for the US economy. Dollar spot index (Source: Bloomberg) The dollar resumed its decline on Friday Read More…
Euro Continues to Surge on Weakening USD
Weekly Chart Daily Chart Technical Key Points Indicator/Zone Status Reflection Weekly Fib 61.8% Cleared Major bullish technical trigger Weekly MACD Bullish cross Strong momentum confirmation Daily SMAs Bullish trend Golden Cross formation Daily RSI Overbought but stable Caution for minor pullbacks, not trend reversal Pivot Structure Breaking R2 toward R3 Signs of powerful trend continuation Read More…